this page uses everything an article on this blog can use, and says how each thing is written. it is also the page to open after changing the blog, to see that nothing broke.
version 25 · · sha-256 28326cb71a7854059518b544efc78dca01d98b4510c8342bc585b91535690499
the blog is one html page, the frame. it holds the sidebar, the type and the list of articles. an article is a plain fragment of html in a folder of its own, and the folder is its address. the frame sets it on the page, however the reader came to it. whatever an article needs beyond prose and tables, a chart, a block of code, a note in the margin, is a piece: a small script, a stylesheet or both, fetched only by the articles that use it.
<svg> written into the article, in the same inks as the charts.nothing comes from another site: no fonts, no scripts, no counters.1 four words come up again and again below:
| piece | weight |
|---|---|
| chart | 5.5 kb |
| dump | 5.1 kb |
| code | 4.7 kb |
| graph | 3.5 kb |
| notes | 3.4 kb |
| bars | 3.0 kb |
| listing | 2.7 kb |
| knob | 2.7 kb |
every address is a folder with a page in it, so the blog runs from any static host, in any folder, with nothing to configure: typography/ is a section, typography/everything-this-blog-can-do/ is this page, and tag/blog/ is everything filed under a tag. every heading like the one above has an address of its own, after a #, and a line in the sidebar. the addresses the blog had before, like #/typography, still lead to the right place.
before any piece, this is what the frame does for every article:
related, chosen by
scripts/head.mjs from the library and named in the article's first lines, so the reader's browser does no choosing. what the foot leads to already is left out, and so is the same article in another language. this one shares no tag with another, so its foot has none, and with the five articles there are now no foot has one: the ones that share tags sit beside each other in a section, or translate each other.prefers-contrast: more.one piece comes with length, not with anything written: an article that takes 20 minutes or more to read, as this one does, keeps the part its reader left off at, in their own browser, and offers it when they come back. read past a heading or two, close the tab, and open this article again from its address: a note at the foot of the screen leads back to the part, and escape or a scroll sends it away. nothing is kept short of the first heading, and the part is let go at the end.
two more things belong to the frame without being part of it. the frame only knows how to fetch them, and does so when a reader first asks. the search is one: the entry under the sections, or /. it answers at once from titles, decks and tags, then reads the words of every article and searches those as well: a file written beside the feed, each article cut at its headings with its markup taken out, a quarter lighter than the feed and nothing to take apart. under each article it found are the parts that say what was asked for, and each is a link to that heading. try it with glider
: it finds this sentence, and the clip under images. nothing typed there is sent anywhere.
the other is a handful of keys, for reading without the mouse:
| key | what it does |
|---|---|
| / | opens the search. ? does too, and the keys are listed at its foot |
| j k | down and up one part of an article. in a list of articles, down and up one article |
| n o | the newer article and the older one |
| u | up, from an article to its section and from a section to the front |
single keys can get in the way of software that types for its reader, so the foot of the search has a switch that turns them off, remembered on that device. the two together weigh 5.0 kb, and a reader who never presses a key or opens the search never fetches a byte of them.
everything visible is lowercase. a capital survives only where it carries meaning, and the markup has to say so:
the bacterium Escherichia coli carries the gene lacZ in its DNA and grows best near pH 7. to check an article, type node scripts/check.mjs. to close a picture, press esc. and a phrase can be picked out like this one.
it reads like an article, never like a dashboard
<p>the bacterium <i lang="la">Escherichia coli</i> carries the gene <var>lacZ</var>
in its <abbr title="deoxyribonucleic acid">DNA</abbr> and grows best near
<span data-case>pH</span> 7. … press <kbd>esc</kbd>. and <mark>a phrase can be
picked out</mark> like this one.</p>

<blockquote>
  <p>it reads like an article, never like a dashboard</p>
  <p class="meta">— the first rule in <cite>the readme</cite></p>
</blockquote>
seven things keep their capitals:
<code>, <pre> and <kbd>: code, and keys.<cite> and <blockquote>: a citation, and someone else's words.<abbr>: an abbreviation, set a little smaller so its capitals do not shout.lang on anything: a scientific name, or a phrase in another language.<var> and <math>: a symbol, and a formula.data-case on anything: a unit, a product, a name that insists.class="qty": a quantity, whose unit may need them.a quantity is a number and a unit that belong together. marked up as one, it is never broken across two lines, and the space typed between its parts is set as a thin one:
light crosses 299 792 458 m/s, a mole holds 6.022 × 10²³ things, the earth leans 23° 26′ from upright, and nothing gets colder than −273.15 °C, which is 0 K.
a quantity can also be written the way a program prints it, and is then set the way a paper does. an electron carries 1.602176634e-19 C, betelgeuse stands at 5h 55m 10.3s, and the universe is growing by 67.4 +- 0.5 km/s for every megaparsec (planck 2020). in the page's own source those are 1.602176634e-19 C, 5h 55m 10.3s and 67.4 +- 0.5 km/s, and that is how the feed still gives them.
chemistry is typed the same plain way, in a <span class="chem">, where it also keeps its capitals. a number after a letter goes below the line and one in front stays, a caret raises a charge or a mass number, and -> is an arrow. a leaf makes sugar by 6CO2 + 6H2O -> C6H12O6 + 6O2, a sulfate ion is SO4^2-, and the carbon that dates a bone is ^14C.
the checker holds a quantity to the signs made for it: a minus and not a hyphen, a multiplication sign and not the letter beside it, primes and not straight quotes, a raised power and not a caret.
a key is a <kbd>, and so is the button of a controller, with class="pad": round when it holds one sign, a pill when it holds more, and ringed in one of the four inks when the button has a colour of its own. the best known cheat in games is ↑ ↑ ↓ ↓ ← → ← → B A, and then start. buttons held together go inside one more <kbd>, which keeps them on a line: A + B + select + start sends most game boy games back to their title screen.
and what a reader may not want to know yet can wait under a cover, until it is clicked or opened from the keyboard with enter. the first seven castles of Super Mario Bros. all end on the same news: the princess is in another castle.
<span class="qty">6.022 × 10<sup>23</sup></span>
<span class="qty">−273.15 °C</span>
<span class="qty">67.4 +- 0.5 km/s</span>
<span class="chem">6CO2 + 6H2O -> C6H12O6 + 6O2</span>
<kbd class="pad">↑</kbd> <kbd class="pad" data-ink="2">B</kbd> <kbd class="pad">start</kbd>
<kbd><kbd class="pad">A</kbd> + <kbd class="pad">B</kbd></kbd>
<span class="spoiler">the princess is in another castle</span>the cover is put on by the same script that takes it off. a reader whose browser runs no scripts, or reads the article in a feed, gets the sentence plain.
words in another language ask for more. a sentence taken apart word by word is a <dl class="gloss">: each word in a <div> with what it means under it, and the pairs wrap the way words do. the labels of grammar go in <abbr>, and are set in small capitals.
a reading set over a word is a <ruby>, which browsers have long known how to set: 日本語 is the japanese word for the japanese language, with the way it is said written over it in the script that spells sounds.
<dl class="gloss">
  <div><dt lang="es">sabés</dt><dd>know.<abbr>2SG</abbr></dd></div>
  <div><dt lang="es">que</dt><dd>that</dd></div>
</dl>

<ruby lang="ja">日本語<rt>にほんご</rt></ruby>
an original and its translation are a <figure class="facing">. the paragraphs are written in turn, one of each, and set in two columns, so every pair starts level however long either half runs. on a narrow page each translation goes under its original.
Gallia est omnis divisa in partes tres, quarum unam incolunt Belgae, aliam Aquitani, tertiam qui ipsorum lingua Celtae, nostra Galli appellantur.
all gaul is divided into three parts. the belgae live in one, the aquitani in another, and in the third those who are called celts in their own tongue, and gauls in ours.
Hi omnes lingua, institutis, legibus inter se differunt.
all of them differ from one another in language, in customs and in laws.
Gallos ab Aquitanis Garumna flumen, a Belgis Matrona et Sequana dividit.
the river garonne parts the gauls from the aquitani, and the marne and the seine part them from the belgae.
and a source set down as it was written is a <blockquote class="source"> around a list of its lines. the lines are numbered the way an edition numbers them, the first and every fifth. a quotation keeps its capitals, so these do. what an editor has supplied goes in an <ins> and is set in brackets, and an empty one is a gap nobody could fill.
- SENATVS · POPVLVS · QVE · ROMANVS
- IMP · CAESARI · DIVI · NERVAE · F · NERVAE
- TRAIANO · AVG · GERM · DACICO · PONTIF
- MAXIMO · TRIB · POT · XVII · IMP · VI · COS · VI · P · P
- AD · DECLARANDVM · QVANTAE · ALTITVDINIS
- MONS · ET · LOCVS · TANTIS · OPERIBVS · SIT · EGESTVS
<figure class="facing">
  <p lang="la">Gallia est omnis divisa in partes tres, …</p>
  <p>all gaul is divided into three parts. …</p>
</figure>

<blockquote class="source" lang="la">
  <ol>
    <li>AD · DECLARANDVM · QVANTAE · ALTITVDINIS</li>
    <li>MONS · ET · LOCVS · TANT<ins>IS · OPER</ins>IBVS · SIT · EGESTVS</li>
  </ol>
</blockquote>
some things have to be heard. a link to a sound file with class="say" gets a mark to press: the sound plays in the page, and stops when it is pressed again. nothing is fetched before that, and nothing ever plays by itself. this is one note, twice: the a that orchestras tune to, 440 vibrations a second, first as a square wave and then as a sine. the pitch is the same and the sound is not.
<a class="say" href="a440.wav">one note, twice</a>and each word can carry a number. in a <p class="tokens">, every word written as a <data value="…"> is tinted by how large its number is, the way a cell is in a table with class="heat". the scale is written under the text with what the numbers count, and pointing at a word gives its own. writing about language models, it is the usual way to show how much weight each word was given. here it is one of this blog's rules, each word tinted by how many times this article had used it when the sentence was added, on , among 15,046 words:
it reads like an article, never like a dashboard
the numbers run from 2 to 698, so the scale is in powers of ten, which is what data-log asks for. data-min and data-max pin its ends, for two paragraphs that should be read against each other, and numbers on both sides of zero take an ink for each side.
<p class="tokens" data-log data-unit="times in this article">
  <data value="303">it</data> <data value="16">reads</data> <data value="17">like</data> …
</p>a list is bullets, numbers, or terms with their definitions, and this page uses all three. seven more kinds are drawn with more than a marker.
a list inside a list, with class="tree", is drawn with its branches. this is the folder the blog is served from:
blog/
index.html the frame, with the library at its footfeed.xmlassets/
site.css, site.js the rest of the framefonts/tree.css and a file or two like it for every other piecescripts/
check.mjstour.mjs which measures this articletypography/
index.html the section's pageeverything-this-blog-can-do/
index.html this articleweights.csvstylesheet.png and the rest of what it showssoftware/ and the other sectionstag/ a page for every taga tree can also show a change. a name inside <ins> is new, a name inside <del> is gone, and a <data> is a size, set at the far end of its line so that the sizes make a column. this is what the pull request that added this paragraph did, in bytes as they are stored. nothing has ever been taken out of the blog's folder, so there is no file struck out to show: the only things struck out are the sizes that changed.
assets/
code.css code.js files.css files.js 870matrix.css 692matrix.js 639site.js tabs.css 949tabs.js 1,931tree.css scripts/
check.mjs <ul class="tree">
<li><code>assets/</code>
<ul>
<li><ins><code>tabs.js</code></ins> <data value="1931">1,931</data></li>
<li><del><code>old.js</code></del></li>
<li><code>tree.css</code> <data value="2390"><del>1,985</del> <ins>2,390</ins></data></li>
</ul>
</li>
</ul>with data-across the same list runs across the page, each fork opening to the right of its name. a fork may go without a name, which is all a family tree asks for. these are the great apes, in the order their lines parted (prado-martinez and others 2013):
<ul class="tree" data-across>
  <li>great apes
    <ul>
      <li>orangutans <i lang="la">Pongo</i></li>
      <li>
        <ul>
          <li>gorillas <i lang="la">Gorilla</i></li>
          <li>…</li>
        </ul>
      </li>
    </ul>
  </li>
</ul>
when the lengths should say something, the list is a class="clade" and every item carries a data-length: how long the branch that leads to it is. each tip gets a line of its own, and each branch runs as far across the page as it is long. with data-ago the lengths are time, and an axis under the tree counts back from the tips. with data-unit they are anything else, and a bar of one round length says how much. these are the african apes, by when their genomes parted (scally and others 2012):
<ul class="clade" data-ago="million years">
  <li data-length="8.25">
    <ul>
      <li data-length="1.75">western gorillas</li>
      <li data-length="1.75">eastern gorillas</li>
    </ul>
  </li>
  <li data-length="4">…</li>
</ul>
things done in order are an <ol class="steps">: a number for each, on one line from the first to the last, a <small> for the detail, and a <time> for a step that has one, set beside it. this is how every change reaches the blog, with the times of the one that added this section:
55-small-things-for-words.site: …closes #55, which ties the two together.scripts/check.mjs.main, which moves in no other way.<ol class="steps">
<li><time datetime="2026-10-12T11:14:41-03:00">11:14:41</time> open an issue
<small>it says what is wanted and why.</small></li>
<li>make a branch from it <small>named after the issue.</small></li>
</ol>when it is the thing handed on that matters, and not the hour, the list is an <ol class="flow">: a box for each step and an arrow to the next, across the page for as long as there is room. a list inside a step is what happens there side by side. this is the same road, as a change travels it:
flowchecksmain<ol class="flow">
<li>a branch</li>
<li>a pull request
<ul>
<li>flow</li>
<li>checks</li>
</ul>
</li>
</ol>a conversation is an <ol class="chat">: a turn for each item, and each turn starts with who spoke, in a <b>. it is set like the script of a play, and nobody's words go in a bubble. each speaker gets a mark of their own, in the order they first speak. a turn holds whatever a list item can, so a call to a tool is a block of code. and a turn that runs long is folded until it is asked for, as the third one is here.
$ git log --oneline --first-parent -20git
ff17ef0 site: an article names the pieces it needs, and the frame stops growing with them (#88)
f9f097b site: glosses, facing text, sources as written, kinds of source, and a sound (#86)
04cc995 site: bits, traces and alignments (#84)
a77e419 site: tabs, sessions at a terminal, yes and no, changes in a tree, and downloads with a sum (#82)
db8741b site: pipelines, graphs and trees with lengths (#80)
a5a01ca site: distributions, flows and treemaps (#78)
eec2d02 site: areas, slopes, bars back to back, waterfalls and indexed lines (#76)
f8ba532 site: tracks, deep time and events on a chart (#74)
d1d1360 article: the tour's own numbers, measured again (#72)
4f84a1f fix: a page with many blocks of code is laid out once, not once for every block (#71)
cf420ff site: a title and a description in every article's own file, for link previews (#68)
1dcab41 site: a search, and keys to read without the mouse (#66)
dc83c27 site: notes that open where they are cited, and references that say what kind of evidence they are (#64)
6c2d653 site: more from a picture: marks with a key, before and after, pixel art, and short clips (#62)
ab985a9 site: more ways to read bytes: a diff between two dumps, a map to scale, and sequences (#60)
02eac6d site: code read closely: blocks side by side, callouts, and disassembly listings (#58)
81c346a site: small things for words: quantities, keys, trees, steps, spoilers, and changes that show (#56)
4a1bd96 site: tables to read at a glance: heat, sorting, and changes with a sign (#54)
9145e4f site: tables that draw themselves: ranges, spans, blocks, days, and shares counted out (#52)
bc0a6f5 site: charts that say how sure they are, and against what (#50)git printed on .<ol class="chat">
<li><b>user</b> what were the last things added to the blog?</li>
<li><b>tool <code>git</code></b> <pre><code>ff17ef0 site: an article names the pieces it needs …</code></pre></li>
</ol>a few facts about one thing are a <dl class="card">: terms and what each comes to, ruled like a small table and no wider than a card. in an aside with a name it is the box of facts an encyclopedia sets beside its text. the numbers on this one were counted by running the gun, which is further down, and who found it is as gardner told it.
<dl class="card">
  <dt>period</dt><dd>30 generations</dd>
</dl>
the last kind is the list at the top of this page: files that travel with an article are a <ul class="files"> of links. a paragraph under a link says what is known about the file: which version it is, when it was made, and its sha-256, which is shown by its two ends and copied whole. the checker takes the sum of the file again on every run, so a file that changes without its line changing fails.
<ul class="files">
  <li><a href="weights.csv" download>the weights behind the charts <small>csv · 2.7 kb</small></a>
    <p>version 25 · <time datetime="2026-10-16">16 october 2026</time> · sha-256 <code>28326cb7…690499</code></p></li>
</ul>a table may run wider than the text, and scrolls sideways when it has to. the first column names each row and stays put while the rest moves. numbers are set right, in figures of equal width, so they line up.
| #piece | fetched when an article has | script | styles | budget |
|---|---|---|---|---|
| 1chart | a table with the class of a chart | 3.9 kb | 1.6 kb | 6 kb |
| 2dump | a hex dump, a sequence, a map or the layout of a header | 3.2 kb | 1.9 kb | 5.5 kb |
| 3code | a block of code | 3.2 kb | 1.4 kb | 5 kb |
| 4notes | a list of notes or of references | 2.1 kb | 1.4 kb | 3.5 kb |
| 5image | an image | 1.4 kb | 1.1 kb | 3 kb |
| 6aside | an aside, or a section that folds | — | 1.0 kb | 1.5 kb |
| 7math | a formula | — | 0.7 kb | 1 kb |
| the seven | 13.8 kb | 9.1 kb | 25.5 kb |
<tfoot>, which is what the columns come to: the checker adds them up, and refuses a foot that says anything else.<tr>
<th scope="row"><span class="rank">7</span>math</th>
<td class="words">a formula</td>
<td class="none">—</td>
<td class="best">0.7 kb</td>
<td>1 kb</td>
</tr>some tables draw themselves. the numbers stay in their cells, and a last column is added with a picture of each row.
class="range" is for a value and the range it is expected in: a name, a value, a low end and a high end. the range is a band across the middle of the row and the value is a point, so a point outside its band is a number outside its range, and that number is set heavier. every row has a scale of its own, which lets rows in different units share a table. a range with one end has a dash for the other.
| measure | here | at least | at most |
|---|---|---|---|
| characters to a line | 64 | 45 | 75 |
| the same, on a phone | 39 | 45 | 75 |
| line height | 1.5 | 1.5 | — |
| contrast, text | 16.6 | 7 | — |
| contrast, quiet text | 5.1 | 4.5 | — |
| the frame, kb | 13.9 | — | 14 |
| this article, kb | 56.0 | — | 60 |
class="spans" is for things that last: a name, when it starts and when it ends, as numbers, as times on a clock like 1:23.4, or as dates. every row gets a bar on one scale, from the earliest start to the latest end, and the two ends of the scale are written over it. a row with no end is a moment, and gets a point.
| what is fetched | asked for | arrived |
|---|---|---|
| this article | 0 ms | 4.0 ms |
| the upright font | 9.0 ms | 11.7 ms |
| the stylesheet | 9.3 ms | 11.1 ms |
| the script | 9.3 ms | 12.0 ms |
| the frame | 21.6 ms | 22.8 ms |
| the italic font | 32.5 ms | 33.8 ms |
| its pieces | 106.4 ms | 149.0 ms |
rows that follow each other under one name are a track: the name is said once, and they share its line. a gene is the usual case, its exons on one line and the stretches that are read into protein on the next.
| what | from | to |
|---|---|---|
| exons | 1 | 142 |
| exons | 273 | 495 |
| exons | 1,346 | 1,608 |
| read into protein | 51 | 142 |
| read into protein | 273 | 495 |
| read into protein | 1,346 | 1,474 |
| the sickle-cell letter | 70 |
T where an A should be, gives sickle-cell disease.a start or an end can also lie deep in the past, 541 mya or 12 ka, or before year one, 44 bce. when the times are too far apart for one ruler, data-log sets the scale in powers of ten. zero has no place on such a scale, so the present is put one power of ten past the nearest time the table names.
| stretch | from | to |
|---|---|---|
| hadean | 4,567 mya | 4,031 mya |
| archean | 4,031 mya | 2,500 mya |
| proterozoic | 2,500 mya | 538.8 mya |
| paleozoic | 538.8 mya | 251.9 mya |
| mesozoic | 251.9 mya | 66 mya |
| cenozoic | 66 mya | 0 mya |
| pleistocene | 2.58 mya | 11.7 ka |
| holocene | 11.7 ka | 0 ka |
three more classes are for reading a table at a glance. with class="sort" every column head is a button: one click puts the rows in order by that column, a second turns the order round, and a third puts them back the way they were written. numbers start from the largest, words from a.
| piece | fetched when an article has | script | styles | budget |
|---|---|---|---|---|
| code | a block of code | 3.2 kb | 1.4 kb | 5 kb |
| pair | two blocks side by side | — | 0.3 kb | 0.5 kb |
| callouts | numbered marks in a block | 0.4 kb | 0.8 kb | 1.5 kb |
| tabs | blocks behind tabs | 0.8 kb | 0.5 kb | 1.5 kb |
| listing | a listing of machine code | 1.9 kb | 0.9 kb | 3 kb |
| chart | a table with the class of a chart | 3.9 kb | 1.6 kb | 6 kb |
| bars | a chart drawn as bars | 1.9 kb | 1.1 kb | 3.5 kb |
| lines | a chart drawn as lines | 2.4 kb | — | 2.5 kb |
| dots | a chart drawn as dots | 2.4 kb | — | 2.5 kb |
| plot | a chart drawn as lines or as dots | — | 1.6 kb | 2 kb |
| areas | a chart drawn as areas | 1.2 kb | 0.3 kb | 1.5 kb |
| slope | a chart drawn as slopes | 1.5 kb | 0.4 kb | 2 kb |
| hist | a histogram, or boxes | 1.6 kb | 0.8 kb | 2.5 kb |
| flows | a table of flows | 1.6 kb | 0.6 kb | 2.5 kb |
| treemap | a list drawn as tiles by size | 1.8 kb | 0.7 kb | 2.5 kb |
| graph | a table of edges | 2.4 kb | 1.0 kb | 3.5 kb |
| flow | a pipeline | — | 0.7 kb | 1 kb |
| clade | a tree with lengths | 1.4 kb | 0.9 kb | 2.5 kb |
| events | events listed under a chart | 0.8 kb | 0.6 kb | 1.5 kb |
| blocks | a table of blocks | 1.4 kb | 0.5 kb | 2 kb |
| days | a table of days | 1.3 kb | 0.7 kb | 2 kb |
| spark | a sparkline | 0.6 kb | 0.4 kb | 1 kb |
| range | a table of ranges | 0.9 kb | 0.7 kb | 2 kb |
| spans | a table of spans | 1.4 kb | 0.6 kb | 2 kb |
| of | a share to count out | 0.7 kb | 0.6 kb | 1.5 kb |
| heat | a table tinted by its numbers | 0.7 kb | 0.5 kb | 1.5 kb |
| sort | a table that sorts | 1.0 kb | 0.6 kb | 2 kb |
| delta | a change with a sign | 0.3 kb | 0.4 kb | 1 kb |
| qty | a quantity | 0.5 kb | 0.3 kb | 1 kb |
| pad | the buttons of a controller | — | 0.5 kb | 1 kb |
| tree | a tree of files | — | 0.9 kb | 1 kb |
| steps | a list of steps | — | 0.5 kb | 1 kb |
| spoiler | text under a cover | 0.4 kb | 0.4 kb | 1 kb |
| revise | a correction, or a list of changes | 0.5 kb | 0.8 kb | 1.5 kb |
| aside | an aside, or a section that folds | — | 1.0 kb | 1.5 kb |
| math | a formula | — | 0.7 kb | 1 kb |
| image | an image | 1.4 kb | 1.1 kb | 3 kb |
| marks | an image with marks on it | 1.1 kb | 1.1 kb | 2.5 kb |
| compare | two images to compare | 0.9 kb | 0.9 kb | 2 kb |
| pixel | pixel art, or a palette | 0.8 kb | 0.6 kb | 1.5 kb |
| clip | a short clip | 1.1 kb | 0.6 kb | 2 kb |
| notes | a list of notes or of references | 2.1 kb | 1.4 kb | 3.5 kb |
| dump | a hex dump, a sequence, a map or the layout of a header | 3.2 kb | 1.9 kb | 5.5 kb |
| seq | a sequence | 0.8 kb | — | 1 kb |
| align | sequences set under each other | 1.1 kb | 0.5 kb | 2 kb |
| map | a map of a file or of memory | 0.8 kb | — | 1 kb |
| files | a list of downloads | 0.5 kb | 1.0 kb | 1.5 kb |
| matrix | a table of yes and no | 0.4 kb | 0.5 kb | 1 kb |
| trace | a table of states, step by step | 0.4 kb | 0.3 kb | 1 kb |
| gloss | a gloss word under word, or ruby | — | 0.5 kb | 0.5 kb |
| facing | a text facing its translation | — | 0.4 kb | 0.5 kb |
| source | a source as it was written | — | 0.4 kb | 0.5 kb |
| say | a sound to hear | 0.5 kb | 0.3 kb | 1 kb |
| chat | a conversation | 0.8 kb | 1.0 kb | 2 kb |
| tokens | words tinted by a number | 1.0 kb | 0.7 kb | 2 kb |
| board | a grid written in characters | 0.7 kb | 0.7 kb | 1.5 kb |
| frames | frames in one place, or pictures that blink | 1.4 kb | 0.8 kb | 2.5 kb |
| card | a card of facts | — | 0.5 kb | 0.5 kb |
| scale | a picture with a scale bar | 0.8 kb | 0.4 kb | 1.5 kb |
| set | panels with letters | — | 0.8 kb | 1 kb |
| sky | a chart of the sky | 1.7 kb | 0.8 kb | 2.5 kb |
| tiles | a map of tiles | 1.1 kb | 0.8 kb | 2 kb |
| chem | a chemical formula | 0.5 kb | 0.2 kb | 1 kb |
| knob | a number a reader can change | 2.2 kb | 0.5 kb | 3 kb |
| curve | a curve from a formula | 2.1 kb | — | 2.5 kb |
| sum | a table with a foot | — | 0.2 kb | 0.5 kb |
| glossary | a glossary | 0.7 kb | 0.6 kb | 1.5 kb |
| fig | a numbered figure | — | 0.2 kb | 0.5 kb |
| resume | an article of 20 minutes or more | 1.2 kb | 0.4 kb | 2 kb |
class="heat" tints every cell by how large its number is, in one hue from the paper up. the numbers stay, so the tint is a second way to read them. one scale covers the table, unless data-by="column" or data-by="row" gives each its own. numbers on both sides of zero take two inks, one for each side.
| file | level 1 | level 3 | level 6 | level 9 |
|---|---|---|---|---|
| feed.xml | 23.8% | 22.2% | 20.1% | 19.6% |
| this article | 30.1% | 28.4% | 25.9% | 25.7% |
| site.css | 33.4% | 31.5% | 29.0% | 28.9% |
| index.html | 34.2% | 33.4% | 32.3% | 32.3% |
| site.js | 39.0% | 37.5% | 35.2% | 35.2% |
| chart.js | 43.1% | 42.0% | 40.3% | 40.3% |
| math.css | 51.5% | 50.8% | 49.9% | 49.9% |
| stylesheet.png | 97.8% | 97.8% | 97.7% | 97.7% |
| newsreader-core.woff2 | 100.1% | 100.1% | 100.1% | 100.1% |
and class="delta" on a cell marks a number as a change: an arrow goes in front of it, up or down by its sign, in an ink for each.
| pull request | what it brought | the frame after | change |
|---|---|---|---|
| #33 | a feed | 11,802 | +78 |
| #35 | cells of words that wrap | 11,933 | +131 |
| #46 | a shorter list of pieces, and downloads in a piece | 11,647 | −286 |
| #48 | a piece for each form of chart | 11,665 | +18 |
| #50 | charts that say how sure they are | 11,665 | 0 |
| #52 | tables that draw themselves | 11,696 | +31 |
and a table of yes and no is a class="matrix". every cell starts with yes, no or partly, and shows a disc for it: full, empty or half. the word stays inside the mark, for a screen reader and for whoever copies the table, and whatever a cell says after its word stays beside it. this is what a block of code gets a colour for, by language:
| language | comments | strings | numbers | names |
|---|---|---|---|---|
| js | yes | yes | yes | no |
| css | yes | yes | yes | no |
| json | no it has none | partly values, not keys | yes | no |
| html | yes | yes | yes | yes of tags |
<table class="matrix">
  <tr><th scope="row">json</th><td>no <small>it has none</small></td><td>partly</td><td>yes</td></tr>
</table>a block of code gets a button that copies it. a label says where it came from. the language, written the way markdown tools already write it, turns on colour: comments step back, strings and numbers step forward, and everything else stays ink. keywords are left alone on purpose, so a page of code stays calm.
export const pieces = [
  ['code', 'js css', 'pre'],
  ['pair', 'css'],
  ['callouts', 'js css'],
  ['tabs', 'js css'],
  ['listing', 'js css'],
  ['chart', 'js css', '.bars .lines .dots .blocks .days .areas .slope .hist .box .flows .sky .tiles .curve'],
  ['bars', 'js css'],
  ['lines', 'js'],
  ['dots', 'js'],
  ['plot', 'css', '.lines .dots .areas .slope .curve'],
  ['areas', 'js css'],
  ['slope', 'js css'],
  ['hist', 'js css', '.hist .box'],
  ['flows', 'js css'],
  ['treemap', 'js css'],
  ['graph', 'js css'],
  ['flow', 'css'],
  ['clade', 'js css'],
  ['events', 'js css'],
  ['blocks', 'js css'],
  ['days', 'js css'],
  ['spark', 'js css'],
  ['range', 'js css'],
  ['spans', 'js css'],
  ['of', 'js css'],
  ['heat', 'js css'],
  ['sort', 'js css'],
  ['delta', 'js css'],
  ['qty', 'js css'],
  ['pad', 'css'],
  ['tree', 'css'],
  ['steps', 'css'],
  ['spoiler', 'js css'],
  ['revise', 'js css', 'ins del .changes'],
  ['aside', 'css', 'aside details'],
  ['math', 'css', 'math'],
  ['image', 'js css', 'img'],
  ['marks', 'js css'],
  ['compare', 'js css'],
  ['pixel', 'js css', '.pixel .palette'],
  ['clip', 'js css'],
  ['notes', 'js css', '.notes .refs'],
  ['dump', 'js css', '.hex .seq .fields .map .align'],
  ['seq', 'js'],
  ['align', 'js css'],
  ['map', 'js'],
  ['files', 'js css'],
  ['matrix', 'js css'],
  ['trace', 'js css'],
  ['gloss', 'css', '.gloss ruby'],
  ['facing', 'css'],
  ['source', 'css'],
  ['say', 'js css'],
  ['chat', 'js css'],
  ['tokens', 'js css'],
  ['board', 'js css'],
  ['frames', 'js css', '.frames .blink'],
  ['card', 'css'],
  ['scale', 'js css', '[data-across]'],
  ['set', 'css'],
  ['sky', 'js css'],
  ['tiles', 'js css'],
  ['chem', 'js css'],
  ['knob', 'js css'],
  ['curve', 'js'],
  ['sum', 'css', 'tfoot'],
  ['glossary', 'js css'],
  ['fig', 'css'],
];

const calls = (html) => ([name, , signs = `.${name}`]) =>
  signs.split(' ').some((sign) =>
    RegExp(sign[0] === '.' ? `<[^>]+class="[^"]*\\b${sign.slice(1)}\\b` : sign[0] === '[' ? `<[^>]+\\s${sign.slice(1, -1)}[=\\s>]` : `<${sign}[\\s>]`).test(html),
  );
that is the whole list of pieces, and the four lines that read it: a name, what to fetch, and the tags, classes or attributes that call for it, the piece's own name when none are given. the frame never sees the list. a script reads it, and writes at the top of each article the pieces that article needs, so the frame weighs the same however long the list grows. the lines are numbered from 7, where the list starts in the file, and line 13 is marked. a long line does not wrap, and the last but one is long: the block grows past the text until it meets the edge of the page, and scrolls after that.
a patch is a block in the language diff. the lines it adds and removes are tinted:
@@ -652,7 +652,13 @@
-.prose :is(th, td).l {
+.prose :is(th, td):is(.l, .words) {
   text-align: left;
 }
+
+/* a cell of words rather than a number: it wraps where it runs long */
+.prose .words {
+  min-width: 10em;
+  white-space: normal;
+}
and a phrase inside a block can be pointed at with <mark>:
python3 -m http.server 4173 # then open http://localhost:4173<pre data-label="scripts/pieces.mjs" data-lines="7" data-mark="13">
<code class="language-js">export const pieces = [
['code', 'js css', 'pre'],
…
];</code></pre>twenty-two languages are known: js, ts, c, cpp, rust, zig, go, java, css, json, python, ruby, sh, make, yaml, toml, asm, sql, lua, html, xml and svg. anything else is shown plain.
the same thing said several ways is a <figure class="tabs"> around the blocks. one shows at a time, under a row of the names their data-labels give them. a name picked in one set is picked in every set on the page that has it, so a language is chosen once. without scripts, and on paper, every block shows. this is a function that counts the steps a number takes to reach one, halving when it is even, and tripling and adding one when it is odd:
int steps(unsigned long n) {
    int count = 0;
    while (n != 1) {
        n = n % 2 ? 3 * n + 1 : n / 2;
        count++;
    }
    return count;
}
def steps(n):
count = 0
while n != 1:
n = 3 * n + 1 if n % 2 else n // 2
count += 1
return countfunction steps(n) {
let count = 0;
while (n !== 1) {
n = n % 2 ? 3 * n + 1 : n / 2;
count++;
}
return count;
}and this is each of them asked about twenty-seven. all three say 111.
printf("%d\n", steps(27));print(steps(27))console.log(steps(27));<figure class="tabs">
<pre data-label="c"><code class="language-c">…</code></pre>
<pre data-label="python"><code class="language-python">…</code></pre>
</figure>a session at a terminal is a block of language-console. a line that starts with $, # or % and a space was typed, and so is the line after one that ends in a backslash, when it starts with >. everything else is what came back, and it steps behind. the prompt is not picked up with a selection, and the copy button takes only what was typed. these are the thirty-nine commits on main up to pull request #78, counted by the area each one names. the odd one out is the commit the repository was made with:
$ git rev-list --count --first-parent a5a01ca
39
$ git log --first-parent --format=%s a5a01ca \
>   | cut -d: -f1 | sort | uniq -c | sort -rn
     25 site
      4 fix
      4 article
      3 design
      2 repo
      1 Initial commit
two blocks in a <figure class="pair"> sit side by side, to be read line against line, and stack on a narrow page. pointing at a line picks out the one level with it on the other side, so a blank line is part of the text: it is what keeps the two level. on the left is a function that counts the steps of a collatz sequence, written the way the compiler read it. on the right is what gcc 15.2 made of it at -Os, with the labels named by hand.
int steps(unsigned long n) {
    int count = 0;
    while (n != 1) {

        if (n % 2) {

            n = 3 * n + 1;
            count++;

        }
        n = n / 2;
        count++;
    }
    return count;
}
steps:
xor eax, eax
.loop: cmp rdi, 1
je .done
test edi, 1
je .half
lea rdi, [rdi+rdi*2]
inc eax
inc rdi
.half: shr rdi, 1
inc eax
jmp .loop
.done: retcount = 0, in two bytes where a plain move takes five.+ 1, and after it no jump back to the test at the top. three times an odd number, plus one, is even, so the compiler knows which way the next turn goes and falls straight into the halving.the numbers in the right block are callouts: a <mark data-note="1"> around what is meant, and an <ol class="callouts"> after the block with a line for each number. pointing at a mark lights its line, and pointing at a line lights its mark. the copy button leaves the numbers out.
<figure class="pair">
  <pre data-label="steps.c"><code class="language-c">…</code></pre>
  <pre data-label="gcc -Os"><code class="language-asm">steps:
        <mark data-note="1">xor   eax, eax</mark>
        …</code></pre>
  <figcaption>each line of c sits beside the first instruction that carries it out.</figcaption>
</figure>

<ol class="callouts">
  <li>a register xored with itself is zero.</li>
</ol>
a disassembly is a <pre class="listing">, pasted as objdump prints it. it is set in columns: where each instruction is, the bytes it is made of, and what it says. every jump that lands inside the listing gets an arrow in the gutter, short ones on the inside and long ones further out, and pointing at a jump, or at the place one lands, picks its arrow out. on a phone the bytes step aside. this is the same function, read back out of the object file:
0000000000000000 <steps>:
   0:	31 c0                	xor    eax,eax
   2:	48 83 ff 01          	cmp    rdi,0x1
   6:	74 18                	je     20 <steps+0x20>
   8:	f7 c7 01 00 00 00    	test   edi,0x1
   e:	74 09                	je     19 <steps+0x19>
  10:	48 8d 3c 7f          	lea    rdi,[rdi+rdi*2]
  14:	ff c0                	inc    eax
  16:	48 ff c7             	inc    rdi
  19:	48 d1 ef             	shr    rdi,1
  1c:	ff c0                	inc    eax
  1e:	eb e2                	jmp    2 <steps+0x2>
  20:	c3                   	ret
<pre class="listing" data-label="objdump -d -M intel steps.o">
0000000000000000 <steps>:
0: 31 c0 xor eax,eax
2: 48 83 ff 01 cmp rdi,0x1
6: 74 18 je 20 <steps+0x20>
…
</pre>what a listing does not show at a glance is the shape of the thing: where it forks, and where it comes back round. a <table class="graph"> is a list of edges, one to a row: where it starts, where it ends and, if it has one, a word for it. the things are set in layers down the page, each under what leads to it, and an edge that goes back up is drawn round the side. a class on a row, a to d, gives its edge an ink. this is every way through the function above, by the addresses in the listing:
| from | to | when |
|---|---|---|
0 count = 0 | 2 n is 1? | |
2 n is 1? | 20 return count | yes |
2 n is 1? | 8 n is odd? | no |
8 n is odd? | 10 n = 3n + 1 | yes |
8 n is odd? | 19 n = n / 2 | no |
10 n = 3n + 1 | 19 n = n / 2 | |
19 n = n / 2 | 2 n is 1? | again |
10 back to the test.<table class="graph">
<thead><tr><th>from</th><th>to</th><th>when</th></tr></thead>
<tbody>
<tr><td>n is 1?</td><td>return count</td><td>yes</td></tr>
<tr><td>n is 1?</td><td>n is odd?</td><td>no</td></tr>
<tr class="b"><td>n = n / 2</td><td>n is 1?</td><td>again</td></tr>
</tbody>
</table>and what it does, step by step, is a <table class="trace">: a row for each step, and the state after it. a cell that is not what it was in the row above is picked out, and the rest step back, so the eye goes to what a step did. this is the function asked about the number two, as a debugger stepped through it:
| after | rdi | eax | zero flag |
|---|---|---|---|
0 xor eax,eax | 2 | 0 | 1 |
2 cmp rdi,1 | 2 | 0 | 0 |
6 je 20 | 2 | 0 | 0 |
8 test edi,1 | 2 | 0 | 1 |
e je 19 | 2 | 0 | 1 |
19 shr rdi,1 | 1 | 0 | 0 |
1c inc eax | 1 | 1 | 0 |
1e jmp 2 | 1 | 1 | 0 |
2 cmp rdi,1 | 1 | 1 | 1 |
6 je 20 | 1 | 1 | 1 |
20 ret | 1 | 1 | 1 |
rdi and the count in eax. the zero flag is how a test is remembered until the jump after it: a je jumps only when the flag holds a one.<table class="trace">
<thead><tr><th>after</th><th>rdi</th><th>eax</th><th>zero flag</th></tr></thead>
<tbody>
<tr><th scope="row">xor eax,eax</th><td>2</td><td>0</td><td>1</td></tr>
<tr><th scope="row">cmp rdi,1</th><td>2</td><td>0</td><td>0</td></tr>
</tbody>
</table>a chart is a table with a class. the frame reads the numbers and draws them, and the table stays in the page: a screen reader gets it instead of the drawing, and so does a feed reader. the first column names each row, every other column is a series, and the caption becomes the title.
<figure>
  <table class="bars" data-max="100">
    <caption>how full a budget is</caption>
    <thead><tr><th>part</th><th>used</th></tr></thead>
    <tbody>
      <tr class="a"><th scope="row">the frame</th><td>99%</td></tr>
      <tr><th scope="row">chart</th><td>92%</td></tr>
      …
    </tbody>
  </table>
  <figcaption>one row is picked out, and the scale is pinned at 100.</figcaption>
</figure>| part | used |
|---|---|
| the frame | 99% |
| notes | 98% |
| code | 93% |
| chart | 92% |
| dump | 92% |
| image | 83% |
| aside | 68% |
| math | 66% |
<tr> and the rest step back to grey. the scale is pinned at 100 with data-max, so a full bar means a full budget. these are the frame and the seven pieces of the first table under tables.with several columns of numbers, each row becomes a group of bars, and the head of the table becomes the legend. there are four inks, and no chart draws more than four series.2
| file | as written | gzipped |
|---|---|---|
| site.css | 20.5 kb | 5.9 kb |
| site.js | 19.0 kb | 6.7 kb |
| chart.js | 9.8 kb | 3.9 kb |
| code.js | 8.1 kb | 3.2 kb |
| dump.js | 7.6 kb | 3.2 kb |
numbers below zero put bars on both sides of a line:
| pull request | bytes |
|---|---|
| #10 charts and code | +818 |
| #25 images | +158 |
| #30 tags, series, reading time | +486 |
| #46 room for more pieces | −286 |
| #66 the search and the keys | +228 |
| #88 the list of pieces moves out | −465 |
| #106 the wheel moves the page | +168 |
| #129 real addresses | +776 |
| #177 high contrast | +184 |
| #178 the type in two files | +358 |
when the columns are parts of a whole, class="bars stacked" sets them end to end and writes the total at the tip:
| part | html | styles | script |
|---|---|---|---|
| the frame | 1.23 | 5.94 | 6.71 |
| chart | — | 1.59 | 3.93 |
| dump | — | 1.86 | 3.22 |
| code | — | 1.42 | 3.24 |
| notes | — | 1.38 | 2.07 |
| image | — | 1.12 | 1.36 |
| aside | — | 1.03 | — |
| math | — | 0.66 | — |
two series can also stand back to back. class="bars mirrored" runs the first left from a middle line and the second right, which is how two halves of one thing are compared: two sexes by age, two sides of a trade, two models on the same tests.
| run | haiku 5.5 | deepseek v4.1 flash |
|---|---|---|
| the makers' own tables | 39.2% | 31.2% |
| artificial analysis | 32.8% | 26.8% |
| vals ai | 35.4% | 19.7% |
class="bars waterfall" is for changes that add up. each bar starts where the one above it ended, a rise in one ink and a fall in another, and a row in a <tfoot> is what they come to, drawn from zero.
| stretch | change |
|---|---|
| charts and code, inside the frame | +0.79 kb |
| seven small things | +0.24 kb |
| tags, series and the feed | +0.76 kb |
| the pieces move out | −0.28 kb |
| seven more small things | +0.17 kb |
| the search, the keys, the previews | +0.26 kb |
| gained in all | +1.94 kb |
a number can say how sure it is. a cell written as 52.8 ± 1.6 ms, as 1.16 (1.15–1.18) or as two ends, 36–43, gives a chart an interval as well as a value, and each form draws it in its own way. on a bar it is a whisker:
| command | time |
|---|---|
| node, doing nothing | 14.6 ± 1.9 ms |
| writing the link previews | 62.2 ± 1.7 ms |
| writing the feed | 34.3 ± 2.4 ms |
| checking the blog | 188.9 ± 2.3 ms |
a line chart runs across the rows in order. it does not write every value, so the pointer reads them off it, and a link under it swaps the drawing for the table. data-line on the table is a value to read the rest against: a dotted rule, named in the legend in the words it was written with.
| after | the frame |
|---|---|
| #6 | 9.86 kb |
| #7 | 9.85 kb |
| #10 | 10.65 kb |
| #22 | 10.51 kb |
| #23 | 10.54 kb |
| #24 | 10.55 kb |
| #25 | 10.70 kb |
| #26 | 10.77 kb |
| #27 | 10.84 kb |
| #28 | 10.88 kb |
| #29 | 10.89 kb |
| #30 | 11.36 kb |
| #32 | 11.45 kb |
| #33 | 11.53 kb |
| #35 | 11.65 kb |
| #46 | 11.37 kb |
| #48 | 11.39 kb |
| #52 | 11.42 kb |
| #54 | 11.44 kb |
| #56 | 11.48 kb |
| #58 | 11.50 kb |
| #60 | 11.51 kb |
| #62 | 11.54 kb |
| #66 | 11.76 kb |
| #68 | 11.80 kb |
| #74 | 11.80 kb |
| #76 | 11.82 kb |
| #78 | 11.85 kb |
| #80 | 11.87 kb |
| #82 | 11.88 kb |
| #84 | 11.89 kb |
| #86 | 11.92 kb |
| #88 | 11.46 kb |
| #100 | 11.55 kb |
| #106 | 11.71 kb |
| #109 | 11.83 kb |
| #111 | 11.97 kb |
| #119 | 11.97 kb |
| #126 | 11.98 kb |
| #129 | 12.73 kb |
| #132 | 12.86 kb |
| #175 | 12.86 kb |
| #176 | 12.89 kb |
| #177 | 13.07 kb |
| #178 | 13.42 kb |
| #187 | 13.50 kb |
| #188 | 13.62 kb |
| #189 | 13.74 kb |
| #190 | 13.81 kb |
| #191 | 13.87 kb |
data-line="14 kb, the budget". each step is a pull request that changed the frame, named by its number, from the first to the latest. after #191 it stands 131 bytes from its budget.the numbers over that chart are events: a <dl class="events"> straight after the table, each <dt> saying when in the words of a row, #46, or of two with a dash between them, #30–#35. a moment gets a rule and a stretch gets a band, and the list becomes the key. without the drawing it is still a list of what happened and when.
two measures on different scales never share a chart as they are. set to a common start they can: data-index="low" names a row, and every series becomes a share of what it was there, which is 100.
| effort | index score | cost per task |
|---|---|---|
| low | 29 | $0.02 |
| medium | 34 | $0.05 |
| high | 38 | $0.08 |
| xhigh | 41 | $0.12 |
| max | 43 | $0.21 |
class="areas" piles the series of a line chart on each other, for the parts of a whole as they change. the top edge is the total, and only the bottom series can be read against a flat line, so the one that matters most goes first.
| after | the frame | the pieces | what a reader asks for |
|---|---|---|---|
| #6 | 9.9 kb | 0.0 kb | 0.0 kb |
| #10 | 10.6 kb | 7.5 kb | 0.0 kb |
| #22 | 10.5 kb | 9.2 kb | 0.0 kb |
| #23 | 10.5 kb | 10.1 kb | 0.0 kb |
| #24 | 10.5 kb | 10.7 kb | 0.0 kb |
| #25 | 10.7 kb | 12.7 kb | 0.0 kb |
| #26 | 10.8 kb | 14.8 kb | 0.0 kb |
| #28 | 10.9 kb | 18.2 kb | 0.0 kb |
| #29 | 10.9 kb | 20.2 kb | 0.0 kb |
| #30 | 11.4 kb | 20.2 kb | 0.0 kb |
| #35 | 11.7 kb | 20.2 kb | 0.0 kb |
| #46 | 11.4 kb | 20.9 kb | 0.0 kb |
| #48 | 11.4 kb | 23.6 kb | 0.0 kb |
| #50 | 11.4 kb | 27.6 kb | 0.0 kb |
| #52 | 11.4 kb | 35.3 kb | 0.0 kb |
| #54 | 11.4 kb | 38.5 kb | 0.0 kb |
| #56 | 11.5 kb | 42.2 kb | 0.0 kb |
| #58 | 11.5 kb | 46.8 kb | 0.0 kb |
| #60 | 11.5 kb | 49.6 kb | 0.0 kb |
| #62 | 11.5 kb | 56.1 kb | 0.0 kb |
| #64 | 11.5 kb | 56.8 kb | 0.0 kb |
| #66 | 11.8 kb | 56.8 kb | 5.3 kb |
| #74 | 11.8 kb | 58.8 kb | 5.3 kb |
| #76 | 11.8 kb | 62.7 kb | 5.3 kb |
| #78 | 11.9 kb | 69.7 kb | 5.3 kb |
| #80 | 11.9 kb | 75.4 kb | 5.3 kb |
| #82 | 11.9 kb | 78.8 kb | 5.3 kb |
| #84 | 11.9 kb | 81.0 kb | 5.3 kb |
| #86 | 11.9 kb | 83.1 kb | 5.3 kb |
| #88 | 11.5 kb | 83.1 kb | 5.3 kb |
| #90 | 11.5 kb | 86.5 kb | 5.3 kb |
| #92 | 11.5 kb | 90.5 kb | 5.3 kb |
| #94 | 11.5 kb | 93.2 kb | 6.8 kb |
| #96 | 11.5 kb | 98.7 kb | 6.8 kb |
| #98 | 11.5 kb | 103.7 kb | 6.8 kb |
| #100 | 11.5 kb | 105.2 kb | 6.8 kb |
| #106 | 11.7 kb | 105.3 kb | 6.8 kb |
| #109 | 11.8 kb | 105.3 kb | 6.8 kb |
| #111 | 12.0 kb | 105.3 kb | 6.8 kb |
| #129 | 12.7 kb | 105.2 kb | 6.9 kb |
| #132 | 12.9 kb | 105.2 kb | 6.9 kb |
| #139 | 12.9 kb | 105.7 kb | 6.9 kb |
| #175 | 12.9 kb | 105.9 kb | 6.9 kb |
| #177 | 13.1 kb | 110.2 kb | 6.9 kb |
| #178 | 13.4 kb | 110.1 kb | 6.9 kb |
| #180 | 13.4 kb | 110.4 kb | 6.9 kb |
| #182 | 13.4 kb | 110.7 kb | 6.9 kb |
| #184 | 13.4 kb | 111.0 kb | 6.9 kb |
| #186 | 13.4 kb | 111.0 kb | 6.6 kb |
| #188 | 13.6 kb | 111.0 kb | 6.6 kb |
| #189 | 13.7 kb | 111.0 kb | 6.6 kb |
class="slope" reads a table the other way: a line for each row, running across the columns. with two columns it says what rose and what fell between two moments. with more, and data-flip when the numbers are places in a ranking, it says who overtook whom.
| model | version 2.1 | version 3.0 | version 4.0 |
|---|---|---|---|
| deepseek v4.1 flash | 90.6% | 30.0% | 31.2% |
| opus 5.0 | 89.1% | 43.3% | 51.8% |
| haiku 5.5 | — | — | 39.2% |
charts set side by side in a <figure class="multiples"> share one scale, so they can be read against each other:
| after | kb gzipped |
|---|---|
| #6 | 0.89 kb |
| #7 | 0.89 kb |
| #10 | 0.89 kb |
| #22 | 0.89 kb |
| #23 | 0.89 kb |
| #24 | 0.89 kb |
| #25 | 0.89 kb |
| #26 | 0.89 kb |
| #27 | 0.89 kb |
| #28 | 0.89 kb |
| #29 | 0.89 kb |
| #30 | 0.89 kb |
| #32 | 0.89 kb |
| #33 | 0.92 kb |
| #35 | 0.92 kb |
| #46 | 0.92 kb |
| #48 | 0.92 kb |
| #52 | 0.92 kb |
| #54 | 0.92 kb |
| #56 | 0.92 kb |
| #58 | 0.92 kb |
| #60 | 0.92 kb |
| #62 | 0.92 kb |
| #66 | 0.95 kb |
| #68 | 0.95 kb |
| #74 | 0.95 kb |
| #76 | 0.95 kb |
| #78 | 0.95 kb |
| #80 | 0.95 kb |
| #82 | 0.95 kb |
| #84 | 0.95 kb |
| #86 | 0.95 kb |
| #88 | 0.95 kb |
| #100 | 0.95 kb |
| #106 | 0.95 kb |
| #109 | 1.00 kb |
| #111 | 1.08 kb |
| #119 | 1.08 kb |
| #126 | 1.08 kb |
| #129 | 1.09 kb |
| #132 | 1.22 kb |
| #175 | 1.22 kb |
| #176 | 1.22 kb |
| #177 | 1.22 kb |
| #178 | 1.23 kb |
| #187 | 1.23 kb |
| #188 | 1.23 kb |
| #189 | 1.23 kb |
| #190 | 1.23 kb |
| #191 | 1.23 kb |
| after | kb gzipped |
|---|---|
| #6 | 4.99 kb |
| #7 | 4.97 kb |
| #10 | 5.51 kb |
| #22 | 5.13 kb |
| #23 | 5.14 kb |
| #24 | 5.14 kb |
| #25 | 5.14 kb |
| #26 | 5.12 kb |
| #27 | 5.19 kb |
| #28 | 5.19 kb |
| #29 | 5.19 kb |
| #30 | 5.26 kb |
| #32 | 5.26 kb |
| #33 | 5.27 kb |
| #35 | 5.40 kb |
| #46 | 5.08 kb |
| #48 | 5.08 kb |
| #52 | 5.08 kb |
| #54 | 5.08 kb |
| #56 | 5.08 kb |
| #58 | 5.08 kb |
| #60 | 5.08 kb |
| #62 | 5.08 kb |
| #66 | 5.11 kb |
| #68 | 5.11 kb |
| #74 | 5.11 kb |
| #76 | 5.11 kb |
| #78 | 5.11 kb |
| #80 | 5.11 kb |
| #82 | 5.11 kb |
| #84 | 5.11 kb |
| #86 | 5.11 kb |
| #88 | 5.11 kb |
| #100 | 5.11 kb |
| #106 | 5.09 kb |
| #109 | 5.15 kb |
| #111 | 5.22 kb |
| #119 | 5.22 kb |
| #126 | 5.22 kb |
| #129 | 5.31 kb |
| #132 | 5.31 kb |
| #175 | 5.30 kb |
| #176 | 5.33 kb |
| #177 | 5.51 kb |
| #178 | 5.86 kb |
| #187 | 5.94 kb |
| #188 | 5.94 kb |
| #189 | 5.94 kb |
| #190 | 5.94 kb |
| #191 | 5.94 kb |
| after | kb gzipped |
|---|---|
| #6 | 3.99 kb |
| #7 | 3.99 kb |
| #10 | 4.25 kb |
| #22 | 4.49 kb |
| #23 | 4.51 kb |
| #24 | 4.52 kb |
| #25 | 4.67 kb |
| #26 | 4.77 kb |
| #27 | 4.77 kb |
| #28 | 4.80 kb |
| #29 | 4.81 kb |
| #30 | 5.21 kb |
| #32 | 5.30 kb |
| #33 | 5.34 kb |
| #35 | 5.34 kb |
| #46 | 5.38 kb |
| #48 | 5.40 kb |
| #52 | 5.43 kb |
| #54 | 5.44 kb |
| #56 | 5.49 kb |
| #58 | 5.51 kb |
| #60 | 5.52 kb |
| #62 | 5.55 kb |
| #66 | 5.71 kb |
| #68 | 5.75 kb |
| #74 | 5.75 kb |
| #76 | 5.77 kb |
| #78 | 5.80 kb |
| #80 | 5.81 kb |
| #82 | 5.82 kb |
| #84 | 5.84 kb |
| #86 | 5.87 kb |
| #88 | 5.41 kb |
| #100 | 5.50 kb |
| #106 | 5.67 kb |
| #109 | 5.67 kb |
| #111 | 5.67 kb |
| #119 | 5.67 kb |
| #126 | 5.67 kb |
| #129 | 6.33 kb |
| #132 | 6.33 kb |
| #175 | 6.33 kb |
| #176 | 6.33 kb |
| #177 | 6.33 kb |
| #178 | 6.33 kb |
| #187 | 6.33 kb |
| #188 | 6.45 kb |
| #189 | 6.57 kb |
| #190 | 6.64 kb |
| #191 | 6.71 kb |
on a line, how sure a number is becomes a band around it:
| level | the middle file |
|---|---|
| 1 | 48.8% (44.3–53.9) |
| 2 | 48.5% (44.1–53.5) |
| 3 | 48.1% (43.8–53.3) |
| 4 | 47.5% (42.9–52.8) |
| 5 | 47.3% (42.6–52.6) |
| 6 | 47.3% (42.5–52.6) |
| 7 | 47.3% (42.5–52.6) |
| 8 | 47.3% (42.5–52.6) |
| 9 | 47.3% (42.5–52.6) |
some numbers do not slope. a count stays where it is until something changes it, and class="lines stepped" draws it that way:
| after | pieces |
|---|---|
| #6 | 0 |
| #7 | 0 |
| #10 | 2 |
| #22 | 2 |
| #23 | 3 |
| #24 | 4 |
| #25 | 5 |
| #26 | 6 |
| #27 | 6 |
| #28 | 7 |
| #29 | 7 |
| #30 | 7 |
| #32 | 7 |
| #33 | 7 |
| #35 | 7 |
| #46 | 8 |
| #48 | 13 |
| #52 | 18 |
| #54 | 21 |
| #56 | 27 |
| #58 | 30 |
| #60 | 32 |
| #62 | 36 |
| #66 | 36 |
| #68 | 36 |
| #74 | 37 |
| #76 | 39 |
| #78 | 42 |
| #80 | 45 |
| #82 | 47 |
| #84 | 49 |
| #86 | 53 |
| #88 | 53 |
| #90 | 55 |
| #92 | 58 |
| #94 | 60 |
| #96 | 63 |
| #98 | 66 |
| #100 | 68 |
| #106 | 68 |
| #109 | 68 |
| #111 | 68 |
| #119 | 68 |
| #126 | 68 |
| #129 | 68 |
| #132 | 68 |
| #175 | 68 |
| #176 | 68 |
| #177 | 68 |
| #178 | 68 |
| #187 | 68 |
| #188 | 68 |
| #189 | 68 |
| #190 | 68 |
| #191 | 68 |
two columns of numbers make a scatter with class="dots": across by the first, up by the second. the rows picked out are named, and the rest go grey.
| file | lines | kb gzipped |
|---|---|---|
| index.html | 67 | 1.23 |
| align.css | 39 | 0.47 |
| areas.css | 26 | 0.31 |
| aside.css | 107 | 1.03 |
| bars.css | 121 | 1.07 |
| blocks.css | 42 | 0.53 |
| board.css | 98 | 0.73 |
| callouts.css | 88 | 0.81 |
| card.css | 40 | 0.49 |
| chart.css | 247 | 1.59 |
| chat.css | 116 | 1.04 |
| chem.css | 16 | 0.19 |
| clade.css | 108 | 0.88 |
| clip.css | 74 | 0.60 |
| code.css | 206 | 1.42 |
| compare.css | 120 | 0.93 |
| days.css | 87 | 0.67 |
| delta.css | 35 | 0.38 |
| dump.css | 270 | 1.86 |
| events.css | 63 | 0.58 |
| facing.css | 35 | 0.36 |
| fig.css | 19 | 0.22 |
| files.css | 98 | 1.02 |
| flow.css | 68 | 0.67 |
| flows.css | 68 | 0.61 |
| frames.css | 100 | 0.82 |
| gloss.css | 43 | 0.49 |
| glossary.css | 49 | 0.59 |
| graph.css | 120 | 1.01 |
| heat.css | 43 | 0.52 |
| hist.css | 118 | 0.85 |
| image.css | 144 | 1.12 |
| knob.css | 25 | 0.45 |
| listing.css | 111 | 0.88 |
| marks.css | 143 | 1.12 |
| math.css | 38 | 0.66 |
| matrix.css | 44 | 0.48 |
| notes.css | 134 | 1.38 |
| of.css | 57 | 0.63 |
| pad.css | 57 | 0.55 |
| pair.css | 29 | 0.34 |
| pixel.css | 56 | 0.56 |
| plot.css | 250 | 1.61 |
| qty.css | 23 | 0.25 |
| range.css | 75 | 0.68 |
| resume.css | 21 | 0.44 |
| revise.css | 80 | 0.80 |
| say.css | 23 | 0.33 |
| scale.css | 28 | 0.39 |
| search.css | 211 | 1.32 |
| set.css | 63 | 0.79 |
| site.css | 1,127 | 5.94 |
| sky.css | 87 | 0.77 |
| slope.css | 48 | 0.39 |
| sort.css | 59 | 0.63 |
| source.css | 48 | 0.44 |
| spans.css | 78 | 0.59 |
| spark.css | 46 | 0.40 |
| spoiler.css | 38 | 0.40 |
| steps.css | 57 | 0.50 |
| sum.css | 10 | 0.21 |
| tabs.css | 59 | 0.55 |
| tiles.css | 65 | 0.76 |
| tokens.css | 68 | 0.75 |
| trace.css | 18 | 0.26 |
| tree.css | 130 | 0.95 |
| treemap.css | 80 | 0.73 |
| align.js | 40 | 1.14 |
| areas.js | 54 | 1.18 |
| bars.js | 106 | 1.95 |
| blocks.js | 55 | 1.37 |
| board.js | 20 | 0.67 |
| callouts.js | 18 | 0.44 |
| chart.js | 214 | 3.93 |
| chat.js | 33 | 0.77 |
| chem.js | 15 | 0.49 |
| clade.js | 56 | 1.39 |
| clip.js | 58 | 1.06 |
| code.js | 210 | 3.24 |
| compare.js | 42 | 0.90 |
| curve.js | 92 | 2.08 |
| days.js | 56 | 1.28 |
| delta.js | 10 | 0.33 |
| dots.js | 105 | 2.42 |
| dump.js | 171 | 3.22 |
| events.js | 27 | 0.81 |
| files.js | 22 | 0.48 |
| flows.js | 65 | 1.61 |
| frames.js | 84 | 1.40 |
| glossary.js | 30 | 0.71 |
| graph.js | 110 | 2.45 |
| heat.js | 33 | 0.74 |
| hist.js | 63 | 1.59 |
| image.js | 62 | 1.36 |
| keys.js | 57 | 0.98 |
| knob.js | 124 | 2.21 |
| lines.js | 110 | 2.37 |
| listing.js | 80 | 1.86 |
| look.js | 85 | 1.54 |
| map.js | 29 | 0.81 |
| marks.js | 47 | 1.08 |
| matrix.js | 15 | 0.39 |
| notes.js | 109 | 2.07 |
| of.js | 23 | 0.72 |
| pixel.js | 32 | 0.80 |
| qty.js | 15 | 0.49 |
| range.js | 31 | 0.85 |
| resume.js | 68 | 1.16 |
| revise.js | 20 | 0.48 |
| say.js | 31 | 0.55 |
| scale.js | 27 | 0.76 |
| search.js | 141 | 2.72 |
| seq.js | 24 | 0.78 |
| site.js | 486 | 6.71 |
| sky.js | 63 | 1.72 |
| slope.js | 56 | 1.46 |
| sort.js | 45 | 0.98 |
| spans.js | 57 | 1.39 |
| spark.js | 14 | 0.56 |
| spoiler.js | 21 | 0.44 |
| tabs.js | 50 | 0.84 |
| tiles.js | 44 | 1.15 |
| tokens.js | 39 | 1.05 |
| trace.js | 13 | 0.36 |
| treemap.js | 90 | 1.76 |
some numbers need another kind of scale. data-log counts in powers of ten, for what spans several of them, and data-flip runs a scale backwards, for measures where less is more. each names the axis it is for, x, y or both. a third column of numbers sizes the dots, and the area of a dot is what carries the number.
| planet | distance from the sun, in au | magnitude at its brightest | diameter |
|---|---|---|---|
| mercury | 0.387 | −2.48 | 0.383 |
| venus | 0.723 | −4.92 | 0.949 |
| mars | 1.52 | −2.94 | 0.532 |
| jupiter | 5.20 | −2.94 | 11.21 |
| saturn | 9.57 | −0.55 | 9.45 |
| uranus | 19.17 | 5.38 | 4.01 |
| neptune | 30.18 | 7.67 | 3.88 |
class="dots joined" draws a line through the points in the order of the rows. a line chart spaces its rows evenly, whatever they are called. this one puts each where its number says, so it is the form for a line over uneven time, and with the two scales above, for time counted backwards.
| after | hours before pull request #72 | the frame |
|---|---|---|
| #6 | 14.56 h | 9.86 kb |
| #7 | 14.53 h | 9.85 kb |
| #10 | 13.78 h | 10.65 kb |
| #22 | 13.33 h | 10.51 kb |
| #23 | 13.26 h | 10.54 kb |
| #24 | 13.20 h | 10.55 kb |
| #25 | 13.10 h | 10.70 kb |
| #26 | 12.99 h | 10.77 kb |
| #27 | 12.96 h | 10.84 kb |
| #28 | 12.88 h | 10.88 kb |
| #29 | 12.80 h | 10.89 kb |
| #30 | 12.75 h | 11.36 kb |
| #32 | 12.72 h | 11.45 kb |
| #33 | 12.68 h | 11.53 kb |
| #35 | 12.41 h | 11.65 kb |
| #46 | 2.36 h | 11.37 kb |
| #48 | 2.30 h | 11.39 kb |
| #52 | 1.74 h | 11.42 kb |
| #54 | 1.66 h | 11.44 kb |
| #56 | 1.39 h | 11.48 kb |
| #58 | 1.24 h | 11.50 kb |
| #60 | 1.11 h | 11.51 kb |
| #62 | 0.70 h | 11.54 kb |
| #66 | 0.46 h | 11.76 kb |
| #68 | 0.29 h | 11.80 kb |
with one column of numbers, class="dots" gives each row a line of its own: a point where its number falls, its interval through it, and the number as written at the end. unlike a bar, a point does not start from zero, so it can sit on either side of a rule.
| file | times as long |
|---|---|
| feed.xml | 3.20 (3.19–3.21) |
| this article | 1.72 (1.71–1.73) |
| the model league | 1.54 (1.53–1.56) |
| site.css | 1.19 (1.17–1.20) |
| site.js | 1.06 (1.06–1.07) |
| chart.js | 1.02 (1.00–1.06) |
| code.js | 1.12 (1.06–1.16) |
| lines.js | 1.06 (0.98–1.11) |
| notes.css | 1.01 (0.99–1.06) |
| bars.css | 1.02 (0.99–1.07) |
chart.js, lines.js, notes.css and bars.css the interval reaches the rule: no difference can be told from none.class="blocks" is for things that lie in an order and take up room: the sections of a file, the functions of a binary, what a page sends. each row is a name, a size and a kind. they are drawn as one long strip cut into rows, every block as wide as its size and tinted by its kind, and the legend says what share each kind comes to.
| file | bytes | part |
|---|---|---|
| this article | 57,354 | this article |
| site.css | 6,081 | the frame |
| newsreader-core.woff2 | 41,600 | fonts |
| site.js | 6,869 | the frame |
| index.html | 1,762 | the frame |
| newsreader-italic-core.woff2 | 46,384 | fonts |
| code.js | 3,318 | its pieces |
| code.css | 1,457 | its pieces |
| pair.css | 346 | its pieces |
| callouts.js | 451 | its pieces |
| callouts.css | 825 | its pieces |
| tabs.js | 864 | its pieces |
| tabs.css | 562 | its pieces |
| listing.js | 1,909 | its pieces |
| listing.css | 902 | its pieces |
| chart.js | 4,028 | its pieces |
| chart.css | 1,632 | its pieces |
| bars.js | 1,996 | its pieces |
| bars.css | 1,100 | its pieces |
| lines.js | 2,422 | its pieces |
| dots.js | 2,481 | its pieces |
| plot.css | 1,644 | its pieces |
| areas.js | 1,213 | its pieces |
| areas.css | 314 | its pieces |
| slope.js | 1,500 | its pieces |
| slope.css | 403 | its pieces |
| hist.js | 1,628 | its pieces |
| hist.css | 867 | its pieces |
| flows.js | 1,653 | its pieces |
| flows.css | 628 | its pieces |
| treemap.js | 1,805 | its pieces |
| treemap.css | 747 | its pieces |
| graph.js | 2,507 | its pieces |
| graph.css | 1,037 | its pieces |
| flow.css | 690 | its pieces |
| clade.js | 1,428 | its pieces |
| clade.css | 901 | its pieces |
| events.js | 828 | its pieces |
| events.css | 598 | its pieces |
| blocks.js | 1,404 | its pieces |
| blocks.css | 541 | its pieces |
| days.js | 1,307 | its pieces |
| days.css | 683 | its pieces |
| spark.js | 572 | its pieces |
| spark.css | 410 | its pieces |
| range.js | 875 | its pieces |
| range.css | 696 | its pieces |
| spans.js | 1,424 | its pieces |
| spans.css | 601 | its pieces |
| of.js | 739 | its pieces |
| of.css | 642 | its pieces |
| heat.js | 761 | its pieces |
| heat.css | 531 | its pieces |
| sort.js | 1,008 | its pieces |
| sort.css | 649 | its pieces |
| delta.js | 334 | its pieces |
| delta.css | 390 | its pieces |
| qty.js | 502 | its pieces |
| qty.css | 257 | its pieces |
| pad.css | 560 | its pieces |
| tree.css | 972 | its pieces |
| steps.css | 515 | its pieces |
| spoiler.js | 451 | its pieces |
| spoiler.css | 411 | its pieces |
| revise.js | 488 | its pieces |
| revise.css | 821 | its pieces |
| aside.css | 1,051 | its pieces |
| math.css | 680 | its pieces |
| image.js | 1,391 | its pieces |
| image.css | 1,146 | its pieces |
| marks.js | 1,107 | its pieces |
| marks.css | 1,142 | its pieces |
| compare.js | 917 | its pieces |
| compare.css | 948 | its pieces |
| pixel.js | 817 | its pieces |
| pixel.css | 570 | its pieces |
| clip.js | 1,090 | its pieces |
| clip.css | 616 | its pieces |
| notes.js | 2,115 | its pieces |
| notes.css | 1,408 | its pieces |
| dump.js | 3,297 | its pieces |
| dump.css | 1,903 | its pieces |
| seq.js | 796 | its pieces |
| align.js | 1,170 | its pieces |
| align.css | 486 | its pieces |
| map.js | 829 | its pieces |
| files.js | 494 | its pieces |
| files.css | 1,040 | its pieces |
| matrix.js | 395 | its pieces |
| matrix.css | 491 | its pieces |
| trace.js | 373 | its pieces |
| trace.css | 267 | its pieces |
| gloss.css | 502 | its pieces |
| facing.css | 372 | its pieces |
| source.css | 452 | its pieces |
| say.js | 563 | its pieces |
| say.css | 334 | its pieces |
| chat.js | 792 | its pieces |
| chat.css | 1,061 | its pieces |
| tokens.js | 1,073 | its pieces |
| tokens.css | 763 | its pieces |
| board.js | 690 | its pieces |
| board.css | 752 | its pieces |
| frames.js | 1,434 | its pieces |
| frames.css | 840 | its pieces |
| card.css | 506 | its pieces |
| scale.js | 782 | its pieces |
| scale.css | 396 | its pieces |
| set.css | 813 | its pieces |
| sky.js | 1,758 | its pieces |
| sky.css | 784 | its pieces |
| tiles.js | 1,176 | its pieces |
| tiles.css | 777 | its pieces |
| chem.js | 505 | its pieces |
| chem.css | 195 | its pieces |
| knob.js | 2,267 | its pieces |
| knob.css | 463 | its pieces |
| curve.js | 2,131 | its pieces |
| sum.css | 211 | its pieces |
| glossary.js | 722 | its pieces |
| glossary.css | 604 | its pieces |
| fig.css | 224 | its pieces |
| resume.js | 1,184 | its pieces |
| resume.css | 453 | its pieces |
class="days" is for a number a day: a date in the first column, written year first, and a value in the second. it is drawn as a calendar, a column for each week with monday at the top, and each day is tinted by its number in one hue. the pointer reads a day off it.
| night | lit |
|---|---|
| 2026-10-01 | 78% |
| 2026-10-02 | 68% |
| 2026-10-03 | 57% |
| 2026-10-04 | 45% |
| 2026-10-05 | 34% |
| 2026-10-06 | 24% |
| 2026-10-07 | 15% |
| 2026-10-08 | 8% |
| 2026-10-09 | 3% |
| 2026-10-10 | 0% |
| 2026-10-11 | 0% |
| 2026-10-12 | 2% |
| 2026-10-13 | 6% |
| 2026-10-14 | 11% |
| 2026-10-15 | 18% |
| 2026-10-16 | 26% |
| 2026-10-17 | 34% |
| 2026-10-18 | 44% |
| 2026-10-19 | 53% |
| 2026-10-20 | 63% |
| 2026-10-21 | 72% |
| 2026-10-22 | 80% |
| 2026-10-23 | 88% |
| 2026-10-24 | 94% |
| 2026-10-25 | 98% |
| 2026-10-26 | 100% |
| 2026-10-27 | 99% |
| 2026-10-28 | 96% |
| 2026-10-29 | 89% |
| 2026-10-30 | 81% |
| 2026-10-31 | 71% |
| 2026-11-01 | 60% |
| 2026-11-02 | 49% |
| 2026-11-03 | 38% |
| 2026-11-04 | 27% |
| 2026-11-05 | 18% |
| 2026-11-06 | 11% |
| 2026-11-07 | 5% |
| 2026-11-08 | 2% |
| 2026-11-09 | 0% |
| 2026-11-10 | 0% |
| 2026-11-11 | 3% |
| 2026-11-12 | 7% |
| 2026-11-13 | 12% |
| 2026-11-14 | 19% |
| 2026-11-15 | 27% |
| 2026-11-16 | 36% |
| 2026-11-17 | 45% |
| 2026-11-18 | 55% |
| 2026-11-19 | 65% |
| 2026-11-20 | 74% |
| 2026-11-21 | 83% |
| 2026-11-22 | 91% |
| 2026-11-23 | 96% |
| 2026-11-24 | 99% |
| 2026-11-25 | 100% |
| 2026-11-26 | 97% |
| 2026-11-27 | 92% |
| 2026-11-28 | 84% |
| 2026-11-29 | 75% |
| 2026-11-30 | 64% |
| 2026-12-01 | 53% |
| 2026-12-02 | 42% |
| 2026-12-03 | 32% |
| 2026-12-04 | 23% |
| 2026-12-05 | 15% |
| 2026-12-06 | 9% |
| 2026-12-07 | 4% |
| 2026-12-08 | 1% |
| 2026-12-09 | 0% |
| 2026-12-10 | 1% |
| 2026-12-11 | 3% |
| 2026-12-12 | 8% |
| 2026-12-13 | 13% |
| 2026-12-14 | 20% |
| 2026-12-15 | 29% |
| 2026-12-16 | 38% |
| 2026-12-17 | 48% |
| 2026-12-18 | 58% |
| 2026-12-19 | 68% |
| 2026-12-20 | 78% |
| 2026-12-21 | 87% |
| 2026-12-22 | 94% |
| 2026-12-23 | 98% |
| 2026-12-24 | 100% |
| 2026-12-25 | 99% |
| 2026-12-26 | 94% |
| 2026-12-27 | 88% |
| 2026-12-28 | 79% |
| 2026-12-29 | 69% |
| 2026-12-30 | 58% |
| 2026-12-31 | 48% |
and a share can be counted out. a paragraph with class="of" that says 8 in 100
gets a hundred dots over it, eight of them filled. several in one figure sit side by side.
8 in 100 men of european descent see red and green less apart than most people do.
4 in 1,000 women do.
and a line can sit in a sentence. the frame went from 9.9 kb to 13.9 9.86 9.85 10.65 10.51 10.54 10.55 10.70 10.77 10.84 10.88 10.89 11.36 11.45 11.53 11.65 11.37 11.39 11.42 11.44 11.48 11.50 11.51 11.54 11.76 11.80 11.80 11.82 11.85 11.87 11.88 11.89 11.92 11.46 11.55 11.71 11.83 11.97 11.97 11.98 12.73 12.86 12.86 12.89 13.07 13.42 13.50 13.62 13.74 13.81 13.87 in fifty steps. a sparkline has no axis and no scale: it says which way something went, so the numbers that matter belong in the words around it (tufte 2006).
the frame went from 9.9 kb to 13.9
<span class="spark">9.86 9.85 10.65 10.51 … 13.87</span> in fifty steps.some charts are drawn from the things themselves instead of from a summary of them. the table has a row for each thing that was measured, and the class says what to make of them. class="hist" counts the values into bins. class="box" gives each name a box: the middle half of its values, a line at their median, and whiskers out to the smallest and the largest. a table can ask for both, and then they share a scale.
| kind of pull request | lines added and removed |
|---|---|
| new features | 1,933 |
| new features | 940 |
| new features | 434 |
| new features | 62 |
| new features | 275 |
| new features | 76 |
| new features | 346 |
| new features | 344 |
| new features | 77 |
| new features | 113 |
| new features | 140 |
| new features | 1,059 |
| new features | 538 |
| new features | 758 |
| new features | 284 |
| new features | 583 |
| new features | 496 |
| new features | 399 |
| new features | 711 |
| new features | 147 |
| new features | 504 |
| new features | 250 |
| articles | 861 |
| articles | 537 |
| articles | 655 |
| articles | 744 |
| upkeep | 316 |
| upkeep | 114 |
| upkeep | 210 |
| upkeep | 8 |
| upkeep | 19 |
| upkeep | 36 |
| upkeep | 13 |
| upkeep | 5 |
| upkeep | 9 |
git log --numstat with the feed left out, since a script writes it. the small number beside a name is how many it has. half of them changed fewer than three hundred lines, and a new feature is seldom small.class="flows" is for what goes from one place to another. each row is a source, a destination and an amount, and each becomes a band as thick as its amount, between boxes as tall as everything that passes through them. a destination that is the source of another row gets a column of its own, further right.
| kind of pull request | where | lines added and removed |
|---|---|---|
| new features | the pieces | 5,977 |
| new features | the frame | 1,987 |
| new features | the articles | 925 |
| new features | the scripts | 919 |
| new features | the readme and the flow | 661 |
| articles | the articles | 2,762 |
| articles | the frame | 35 |
| upkeep | the readme and the flow | 346 |
| upkeep | the pieces | 257 |
| upkeep | the frame | 46 |
| upkeep | the scripts | 45 |
| upkeep | the articles | 36 |
a nested list with a number on each leaf, <ul class="treemap">, is drawn as tiles whose areas are the numbers, each group in its own ink. it shows at a glance what a bar chart of fourteen rows makes the eye add up: how much each group comes to. the list stays behind the drawing, one click away.
two more forms are maps. a <table class="sky"> has a row for each star: its right ascension and its declination in degrees, and its magnitude. it is drawn the way an atlas prints the sky, ink on paper, east on the left, a brighter star a larger dot. these are the nine stars marked on the picture of orion, figure 2, from the same numbers:
| star | right ascension | declination | magnitude |
|---|---|---|---|
| betelgeuse | 88.79 | 7.41 | 0.42 |
| bellatrix | 81.28 | 6.35 | 1.64 |
| meissa | 83.78 | 9.93 | 3.66 |
| mintaka | 83.00 | −0.30 | 2.41 |
| alnilam | 84.05 | −1.20 | 1.69 |
| alnitak | 85.19 | −1.94 | 1.77 |
| saiph | 86.94 | −9.67 | 2.06 |
| rigel | 78.63 | −8.20 | 0.13 |
| hatysa | 83.86 | −5.91 | 2.77 |
data-frame on the table pins its edges instead, the way it does for marks.and a <table class="tiles"> draws a map without drawing a coastline. each row is a place, where its tile goes, across and then down, and a number. every place gets a square of one size, tinted by its number, so a small place counts for as much to the eye as a large one. a tile may sit a part of a step along, which staggers the rows. it is made for provinces and countries. here the places are the keys of a keyboard, and the number is how much of this article each letter was on , out of 65,487 letters:
| letter | across | down | % of all letters |
|---|---|---|---|
| q | 1 | 1 | 0.2 |
| w | 2 | 1 | 1.9 |
| e | 3 | 1 | 12.4 |
| r | 4 | 1 | 5.8 |
| t | 5 | 1 | 10.2 |
| y | 6 | 1 | 1.1 |
| u | 7 | 1 | 2.0 |
| i | 8 | 1 | 6.8 |
| o | 9 | 1 | 6.0 |
| p | 10 | 1 | 2.1 |
| a | 1.25 | 2 | 9.1 |
| s | 2.25 | 2 | 8.6 |
| d | 3.25 | 2 | 3.7 |
| f | 4.25 | 2 | 2.4 |
| g | 5.25 | 2 | 2.1 |
| h | 6.25 | 2 | 5.1 |
| j | 7.25 | 2 | 0.3 |
| k | 8.25 | 2 | 1.4 |
| l | 9.25 | 2 | 4.1 |
| z | 1.75 | 3 | 0.1 |
| x | 2.75 | 3 | 0.3 |
| c | 3.75 | 3 | 3.5 |
| v | 4.75 | 3 | 0.7 |
| b | 5.75 | 3 | 2.1 |
| n | 6.75 | 3 | 6.0 |
| m | 7.75 | 3 | 2.2 |
<table class="sky">
  <tr><th scope="row">rigel</th><td>78.63</td><td>−8.20</td><td>0.13</td></tr>
</table>

<table class="tiles">
  <tr><th scope="row">e</th><td>3</td><td>1</td><td>12.4</td></tr>
  <tr><th scope="row">a</th><td>1.25</td><td>2</td><td>9.1</td></tr>
</table>two drawings take a file format apart. the first is a hex dump: bytes written as pairs of hex digits, set sixteen to a row, or eight where sixteen would not fit, with the offset in front and the same bytes as text behind. these are the first 48 bytes of the file this sentence is drawn from, a woff2 file (levantovsky and levien 2018). its first four spell wOF2.
77 4f 46 32 00 01 00 00 00 00 a2 80 00 14 00 00
00 01 31 e8 00 00 a2 0d 00 01 00 00 00 00 00 00
00 00 00 00 00 00 00 00 00 00 00 00 00 00 00 00
a range in a <mark> is tinted in both columns, and named under the dump with where it starts and how long it is. the second drawing is the layout of a header: a table with a row for each field and its size, and above it a strip with every field as wide as it is.
| field | bytes | in this file |
|---|---|---|
| signature | 4 | wOF2 |
| flavour | 4 | truetype outlines |
| length | 4 | 41,600 bytes |
| tables | 2 | 20 |
| reserved | 2 | 0 |
| size unpacked | 4 | 78,312 bytes |
| size packed | 4 | 41,485 bytes |
| major | 2 | 1, the version of the format |
| minor | 2 | 0 |
| metadata offset | 4 | 0, there is none |
| metadata length | 4 | 0 |
| metadata unpacked | 4 | 0 |
| private offset | 4 | 0, there is none |
| private length | 4 | 0 |
with data-unit="bit" the same table is a register, or a byte that packs several things. it is written from its highest bit down, as a register is, and the number on each field is the bit it starts at. this is the last byte of the instruction that triples n in the listing, 48 8d 3c 7f: the byte that says rdi, plus twice rdi
.
| field | bits | holds | which means |
|---|---|---|---|
| scale | 2 | 01 | the second register is doubled |
| index | 3 | 111 | the second register is rdi |
| base | 3 | 111 | the first register is rdi |
<pre class="hex" data-label="assets/fonts/newsreader-core.woff2">
<mark data-label="signature">77 4f 46 32</mark> <mark data-label="flavour: truetype outlines">00 01 00 00</mark> …
</pre>

<table class="fields" data-per="16">
  <thead><tr><th>field</th><th>bytes</th><th>in this file</th></tr></thead>
  <tbody>
    <tr class="a"><th scope="row">signature</th><td>4</td><td><code>wOF2</code></td></tr>
    …
  </tbody>
</table>
two dumps in a <figure class="pair"> are compared, byte against byte, and the ones that are not the same are picked out in both: on the left in the tint a patch gives to what it takes out, on the right in the tint for what it puts in. each face of the blog's type comes in two files, and their headers begin alike. the first of the upright and the first of the italic:
77 4f 46 32 00 01 00 00 00 00 a2 80 00 14 00 00
00 01 31 e8 00 00 a2 0d 00 01 00 00 00 00 00 00
77 4f 46 32 00 01 00 00 00 00 b5 30 00 14 00 00
00 01 52 3c 00 00 b4 bd 00 01 00 00 00 00 00 00
where things sit, in a file or in memory, is a <table class="map">: a name, a start and a size in each row. the strip above it is drawn to scale, except that nothing is drawn too thin to point at, and a stretch that no row accounts for is hatched. this is the object file the listing was read from:
| part | starts at | bytes | what it holds |
|---|---|---|---|
| elf header | 0x000 | 64 | what kind of file this is, and where the section headers are |
.text | 0x040 | 33 | the function: the twelve instructions of the listing |
.comment | 0x061 | 39 | the name and version of the compiler |
.symtab | 0x088 | 72 | three symbols, one of them steps |
.strtab | 0x0d0 | 15 | their names |
.shstrtab | 0x0df | 69 | the names of the sections |
| section headers | 0x128 | 576 | nine entries of 64 bytes, one for each section |
a sequence is not bytes, but it is read the same way. a <pre class="seq"> sets dna, rna or protein in tens under a ruler, six tens to a row where there is room, with the position each row starts at, and names its marked ranges underneath. this is human insulin as the cell first makes it (uniprot P01308):
MALWMRLLPL LALLALWGPD PAAAFVNQHL CGSHLVEALY LVCGERGFFY TPKTRREAED
LQVGQVELGG GPGAGSLQPL ALEGSLQKRG IVEQCCTSIC SLYQLENYCN
the signal is cut off on the way out of the cell's factory, and the c peptide is cut out from between the two chains, which stay joined. the two pairs of letters left untinted are where those cuts are made.
several sequences that are nearly the same are a <pre class="align">: a line for each, its name and then its letters, with a - wherever one of them has nothing. they are set letter under letter. a letter that is not the one the first sequence has there is tinted, a gap is tinted another way, and the last line has a star under every place they all share. these are the first ninety letters of the gene for β-globin that are read into protein (refseq NG_059281.1), and the same letters with three changes that are found in people: the one behind sickle-cell disease, the one behind haemoglobin e (aziz and others 2025), and a loss of two letters that puts every letter after it out of step (tariq and others 2021).
reference    ATGGTGCATCTGACTCCTGAGGAGAAGTCTGCCGTTACTGCCCTGTGGGGCAAGGTGAACGTGGATGAAGTTGGTGGTGAGGCCCTGGGC
hb s         ATGGTGCATCTGACTCCTGTGGAGAAGTCTGCCGTTACTGCCCTGTGGGGCAAGGTGAACGTGGATGAAGTTGGTGGTGAGGCCCTGGGC
hb e         ATGGTGCATCTGACTCCTGAGGAGAAGTCTGCCGTTACTGCCCTGTGGGGCAAGGTGAACGTGGATGAAGTTGGTGGTAAGGCCCTGGGC
codon 5 −ct  ATGGTGCATCTGACTC--GAGGAGAAGTCTGCCGTTACTGCCCTGTGGGGCAAGGTGAACGTGGATGAAGTTGGTGGTGAGGCCCTGGGC
<pre class="align" data-label="hbb">
reference    ATGGTGCATCTGACTCCTGAGGAGAAG…
hb s         ATGGTGCATCTGACTCCTGTGGAGAAG…
codon 5 −ct  ATGGTGCATCTGACTC--GAGGAGAAG…
</pre>
<figure class="pair">
<pre class="hex" data-label="newsreader-core.woff2">77 4f 46 32 … 00 00 a2 80 …</pre>
<pre class="hex" data-label="newsreader-italic-core.woff2">77 4f 46 32 … 00 00 b5 30 …</pre>
</figure>
<table class="map">
<thead><tr><th>part</th><th>starts at</th><th>bytes</th></tr></thead>
<tbody>
<tr><th scope="row">elf header</th><td>0x000</td><td>64</td></tr>
<tr class="a"><th scope="row">.text</th><td>0x040</td><td>33</td></tr>
…
</tbody>
</table>
<pre class="seq" data-label="preproinsulin, homo sapiens">
<mark data-label="signal peptide">MALWMRLLPL LALLALWGPD PAAA</mark><mark data-label="b chain">FVNQHL …</mark>
</pre>a formula is written in mathml, which browsers set by themselves: no script, no font to download (carlisle and wang). it can sit in a line, like the step of a chart's axis, , or take a line of its own. this is how the frame works out the reading time above every title, from the words outside tables and code, and the number of tables and blocks of code:3
<math display="block">
  <mi>minutes</mi><mo>=</mo>
  <mrow><mo>⌈</mo>
    <mfrac><mi>w</mi><mn>230</mn></mfrac><mo>+</mo><mfrac><mi>b</mi><mn>4</mn></mfrac>
  <mo>⌉</mo></mrow>
</math>
numbers and words inside a formula are set in the face of the text around them. a lone letter is a variable and comes out italic. brackets and signs come from the reader's own maths face, so they can look a little different from one machine to the next.
a formula can also be worked out, on numbers the reader changes. a <data class="knob"> is a number in a sentence that is dragged sideways, or moved with the arrow keys, and every <output data-f> works its formula out again. a page that grows by 5% with every pull request weighs times what it did after 10 of them, and twice as much after .
| pull requests | times its weight |
|---|---|
| 0 | 1.0 |
| 10 | 1.6 |
| 20 | 2.7 |
| 30 | 4.3 |
| 40 | 7.0 |
| 50 | 11.5 |
<table class="curve"> holds a few values of a formula and is drawn as the whole line, and again when a knob moves. a formula is arithmetic, read by the piece itself and never run as code. the checker works each one out where the knobs stand, so what the page says without scripts, and in the feed, is true.<data class="knob" data-name="r" data-min="1" data-max="20" value="5"
aria-label="percent it grows by each time">5</data>
<output data-f="(1 + r/100)^n" data-places="1">1.6</output>
<table class="curve" data-f="(1 + r/100)^x">
<tr><th scope="row">10</th><td>1.6</td></tr>
</table>an image lives in the article's folder. it has to say what it shows and how large it is, so the page holds its place while the file is on its way and nothing jumps when it lands. it is fetched when the reader gets near it, never before, and says so itself, with loading="lazy", for a reader who opens the article at its own address. in a figure it opens large on a click, and closes on another click, on esc, or when the page is scrolled on. opened, it can be looked into: the wheel or two fingers bring it closer about the point they are on, a drag moves it, and a click steps back out, to the whole picture first and then to the page. +, - and the arrows do the same. the part that does this is fetched the first time an image is opened.
<figure>
  <a href="stylesheet-large.png">
    <img src="stylesheet.png" alt="five columns of short dark dashes …" width="540" height="330" loading="lazy">
  </a>
  <figcaption>the blog's stylesheet, all 1,127 lines of it …</figcaption>
</figure>
the link around it is optional: without one, the image opens as it is. outside a figure an image sits in the line and does not open, like the dot  that marks the current section in the sidebar. an image may weigh 250 kb at most, and the checker measures the file to see that the width and height written beside it are its real shape.
some pictures need pointing at. an <ol class="marks"> after an image is its key, and each item says where its number goes: data-at="62% 31%", across and then down, as shares of the image. where there is room beside the image the key stands there, so that neither has to be scrolled away to read the other, and pointing at a number lights its line.
a picture of somewhere can be marked in that place's own coordinates instead. data-frame on the list says what the picture's left, bottom, right and top edges are, west south east north on a map, and each data-at is then a place: across, and then up. such a mark is a ring round the place, with its number off to the upper right, or wherever left and down send it. and a picture that says how much it spans, with data-across, gets a bar of a round length to measure by. this is orion, drawn from the positions and magnitudes that simbad holds for its stars (wenger and others 2000). its marks are right ascensions and declinations in degrees, and on a chart of the sky east is on the left, so the frame's first number is the larger:

a figure the text points at from far away can carry a number. class="fig" counts it, and the number is said before its caption: the picture above is figure 2, and the same stars drawn from a table, under charts, are figure 1. the stylesheet does the counting. the checker reads every link that says “figure” and a number, and fails when the number is not the one its figure has.
<figure class="fig" id="orion-picture"> … </figure>

<p>… the picture above is <a href="#orion-picture">figure 2</a>.</p>
two pictures of one thing are compared best in one place. a <figure class="compare"> with two images of the same shape lays the second over the first and puts a divider between them. it can be dragged, sent somewhere with a press, or moved with the arrow keys once it has the focus, and a data-label on an image names its side. the two below are simulated: the belt and the sword from the chart above with the noise of a short exposure added, once, and then sixty-four times over and averaged.

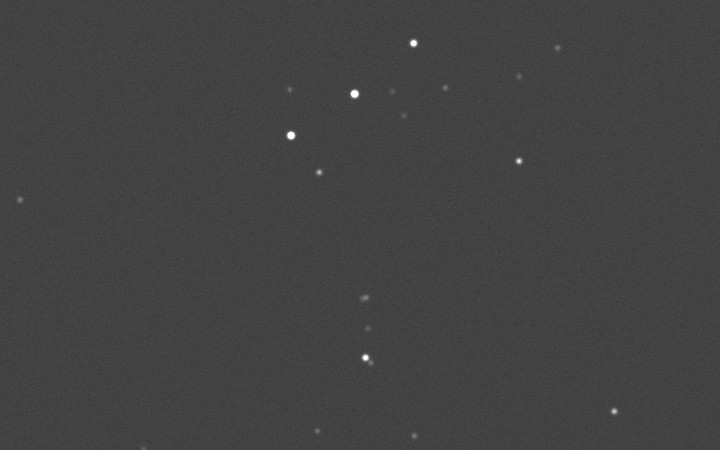
when two pictures should be read side by side, and not one through the other, they are panels. a <figure class="set"> holds a figure for each, letters them in their corners, and keeps one caption under them all. they stand in a row where there is room and under each other where there is not, and each still opens large.
pixel art is the one kind of picture that must never be smoothed. an <img class="pixel"> is shown at a whole multiple of its size, the largest that fits, counted in the pixels of the screen and not of the page, so that each of its pixels is a clean square and all of them are the same size. data-max="4" holds it to four times. the caption is told what the multiple came to.

a <ul class="palette"> shows the colours themselves: each item gets a swatch of the first colour written in it. these are the four greens most often used to stand for the screen of the first game boy, with how many of the scene's 5,184 pixels wear each.
#0f380f 2,039#306230 2,381#8bac0f 633#9bbc0f 131and some things only make sense moving. a short silent loop is written as a still that links to its file, in a <figure class="clip">. that is all a feed reader or a browser without scripts will show, and it is enough. here the still stays until the reader is near, and only then is the clip fetched. it plays while it is in view, rests when it is not, and stops at its button or at a press on the picture. a reader who has asked their system for less motion gets the still, and a button that says play.
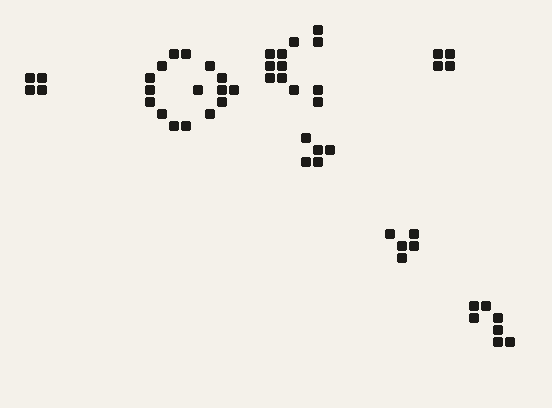
<figure>
  <img src="orion.png" alt="a dark sky with the stars of orion …" width="720" height="900" data-across="18.4°" loading="lazy">
  <ol class="marks" data-frame="92.90 -12.03 74.48 10.82">
    <li data-at="88.79 7.41">betelgeuse <small><i>α</i> · 0.42</small></li>
    <li data-at="85.19 -1.94 left down">alnitak <small><i>ζ</i> · 1.77</small></li>
    …
  </ol>
</figure>

<figure class="compare">
  <img src="one.jpg" alt="a grainy grey frame …" width="720" height="450" data-label="one exposure" loading="lazy">
  <img src="sixty-four.jpg" alt="the same frame, smooth …" width="720" height="450" data-label="sixty-four, averaged" loading="lazy">
</figure>

<figure class="set">
  <figure><img src="one.jpg" alt="a grainy grey frame …" width="720" height="450" loading="lazy"></figure>
  <figure><img src="sixty-four.jpg" alt="the same frame, smooth …" width="720" height="450" loading="lazy"></figure>
  <figcaption><b>a</b> one exposure, <b>b</b> sixty-four, averaged.</figcaption>
</figure>

<figure>
  <img class="pixel" src="scene.png" alt="a night in four greens …" width="96" height="54" loading="lazy">
</figure>

<ul class="palette">
  <li><code>#0f380f</code> 2,039</li>
  …
</ul>

<figure class="clip">
  <a href="gun.mp4"><img src="gun.png" alt="black cells on a pale grid …" width="552" height="408" loading="lazy"></a>
</figure>
some pictures are better written than drawn. a <pre class="board"> is a grid with a character for each cell, and the list after it is its legend: each item starts with the character it explains, and data-ink gives that character one of the four inks. a character the legend leaves out is an empty cell, and a space is no cell at all, which is how four boards stand in one block here. this is a glider, generation by generation, with what the rules are about to do to it:
...... ...... ...... ......
..x... ...... ...... ......
.+.o.. .x.o.. ..+x.. ..x+..
.xoo.. .+xo.. .x.o+. ...xo.
..+... ..o+.. ..oo.. ..oo+.
...... ...... ...... ......
o alive, and staying sox alive, and about to die+ empty, and about to be bornframes that follow each other can share one file. an <img class="frames" data-frames="24"> is a strip of that many frames side by side, shown one at a time, six a second unless data-fps says otherwise. it moves only while it is in view and it can be stopped. stopped, a press on the picture moves it on by one. this glider lives on a board six cells square whose edges are joined, so after twenty-four generations it is back where it began:

and two pictures of one shape can take turns, which is how astronomers used to find what had moved between two plates. in a <figure class="blink"> the pictures lie on each other and swap every 0.8 seconds, or every data-every, and data-label names each one under the picture. this is the gun of the clip above, and the same gun thirty generations later. everything in it is back where it was, and the one new thing is the glider it has let go:
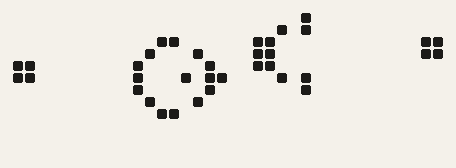
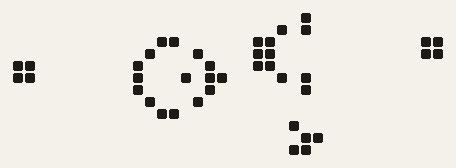
<pre class="board" aria-label="four small boards …">
..x... ......
.+.o.. .x.o..
</pre>
<ul>
  <li data-ink="2"><code>x</code> alive, and about to die</li>
</ul>

<img class="frames" data-frames="24" src="glider.png" alt="…" width="3456" height="144" loading="lazy">

<figure class="blink">
  <img src="gun-0.png" alt="…" width="456" height="168" data-label="generation 0" loading="lazy">
  <img src="gun-30.png" alt="…" width="456" height="168" data-label="generation 30" loading="lazy">
</figure>
the checker holds each of these to its form. a mark needs its place, the two sides of a comparison need one shape, pixel art has to be stored without loss and at the size written beside it, and a clip is an mp4 or a webm of 500 kb at most, behind a still that is checked like any other image.
an <aside> is a note beside the argument. a <strong> at its start gives it a name, and class="warn" turns it into a warning, like the one near the top of this page.
a <details> folds away what most readers will not need. it can hold anything an article can.
weight, gzipped

  the shell (html + css + js)                              13.9 kb  of 14
  the library (5 articles)                                  0.6 kb  of 1.2
  code, for the articles that use it                        4.7 kb  of 5
  pair, for the articles that use it                        0.3 kb  of 0.5
  callouts, for the articles that use it                    1.2 kb  of 1.5
  tabs, for the articles that use it                        1.4 kb  of 1.5
  listing, for the articles that use it                     2.7 kb  of 3
  chart, for the articles that use it                       5.5 kb  of 6
  bars, for the articles that use it                        3.0 kb  of 3.5
  lines, for the articles that use it                       2.4 kb  of 2.5
  dots, for the articles that use it                        2.4 kb  of 2.5
  plot, for the articles that use it                        1.6 kb  of 2
  areas, for the articles that use it                       1.5 kb  of 1.5
  slope, for the articles that use it                       1.9 kb  of 2
  hist, for the articles that use it                        2.4 kb  of 2.5
  flows, for the articles that use it                       2.2 kb  of 2.5
  treemap, for the articles that use it                     2.5 kb  of 2.5
  graph, for the articles that use it                       3.5 kb  of 3.5
  flow, for the articles that use it                        0.7 kb  of 1
  clade, for the articles that use it                       2.3 kb  of 2.5
  events, for the articles that use it                      1.4 kb  of 1.5
  blocks, for the articles that use it                      1.9 kb  of 2
  days, for the articles that use it                        1.9 kb  of 2
  spark, for the articles that use it                       1.0 kb  of 1
  range, for the articles that use it                       1.5 kb  of 2
  spans, for the articles that use it                       2.0 kb  of 2
  of, for the articles that use it                          1.3 kb  of 1.5
  heat, for the articles that use it                        1.3 kb  of 1.5
  sort, for the articles that use it                        1.6 kb  of 2
  delta, for the articles that use it                       0.7 kb  of 1
  qty, for the articles that use it                         0.7 kb  of 1
  pad, for the articles that use it                         0.5 kb  of 1
  tree, for the articles that use it                        0.9 kb  of 1
  steps, for the articles that use it                       0.5 kb  of 1
  spoiler, for the articles that use it                     0.8 kb  of 1
  revise, for the articles that use it                      1.3 kb  of 1.5
  aside, for the articles that use it                       1.0 kb  of 1.5
  math, for the articles that use it                        0.7 kb  of 1
  image, for the articles that use it                       2.5 kb  of 3
  marks, for the articles that use it                       2.2 kb  of 2.5
  compare, for the articles that use it                     1.8 kb  of 2
  pixel, for the articles that use it                       1.4 kb  of 1.5
  clip, for the articles that use it                        1.7 kb  of 2
  notes, for the articles that use it                       3.4 kb  of 3.5
  dump, for the articles that use it                        5.1 kb  of 5.5
  seq, for the articles that use it                         0.8 kb  of 1
  align, for the articles that use it                       1.6 kb  of 2
  map, for the articles that use it                         0.8 kb  of 1
  files, for the articles that use it                       1.5 kb  of 1.5
  matrix, for the articles that use it                      0.9 kb  of 1
  trace, for the articles that use it                       0.6 kb  of 1
  gloss, for the articles that use it                       0.5 kb  of 0.5
  facing, for the articles that use it                      0.4 kb  of 0.5
  source, for the articles that use it                      0.4 kb  of 0.5
  say, for the articles that use it                         0.9 kb  of 1
  chat, for the articles that use it                        1.8 kb  of 2
  tokens, for the articles that use it                      1.8 kb  of 2
  board, for the articles that use it                       1.4 kb  of 1.5
  frames, for the articles that use it                      2.2 kb  of 2.5
  card, for the articles that use it                        0.5 kb  of 0.5
  scale, for the articles that use it                       1.2 kb  of 1.5
  set, for the articles that use it                         0.8 kb  of 1
  sky, for the articles that use it                         2.5 kb  of 2.5
  tiles, for the articles that use it                       1.9 kb  of 2
  chem, for the articles that use it                        0.7 kb  of 1
  knob, for the articles that use it                        2.7 kb  of 3
  curve, for the articles that use it                       2.1 kb  of 2.5
  sum, for the articles that use it                         0.2 kb  of 0.5
  glossary, for the articles that use it                    1.3 kb  of 1.5
  fig, for the articles that use it                         0.2 kb  of 0.5
  resume, for the articles that use it                      1.6 kb  of 2
  keys, when a reader asks for it                           1.0 kb  of 1.5
  search, when a reader asks for it                         4.0 kb  of 4.5
  look, when a reader asks for it                           1.5 kb  of 2
  what the search reads, the first time it is opened       79.9 kb  of 150
  the worker, fetched in the background                     1.4 kb  of 1.5
  fonts, the first file of each face (2)                   85.9 kb  of 86
  gaming/inside-kirby-super-star-ultra/index.html          15.4 kb  of 40
    its 10 images, as stored                              139.7 kb  of 250 each
  typography/everything-this-blog-can-do/index.html        56.0 kb  of 60
    its 12 images, as stored                              304.6 kb  of 250 each
    its clip, as stored                                    10.2 kb  of 500 each
    its sound, as stored                                   29.8 kb  of 100 each
  software/la-liga-de-modelos-de-opencode-go/index.html     7.8 kb  of 40
  software/claude-haiku-5-5/index.html                     17.0 kb  of 40
  software/opencode-go-model-league/index.html              7.2 kb  of 40

all good: 12 sections, 5 articles.
<aside>
<p><strong>the rule behind all of it.</strong> a page pays only for what it uses.</p>
</aside>
<details>
<summary>what the checker printed for this blog</summary>
<pre><code>…</code></pre>
</details>a small number in the text leads to a note. on a wide screen the note moves out into the margin, beside the line that cites it. on a narrow one it waits at the foot of the article, with a caret that leads back, until it is asked for: a press on its number opens it right under the line that cites it, and another puts it away. on paper it stays at the foot. wherever it is, it is only ever in one place. a note cited twice, like the one about the inks,2 gets a letter at the foot for each place that cites it. and when every note has gone to the margin, the list and its heading step aside: on a wide screen this page has no section of notes at all.
a reference is the same idea with a different job. it stays in its list on every screen, keeps the capitals a citation is written with, and can be cited by a number or by name, the way this page is set in newsreader (the newsreader project authors 2020) and its feed is an atom feed (nottingham and sayre 2005).
a reference can also say what kind of evidence it is, which matters most when the subject is health. data-kind takes one of six words, review, trial, observational, lab, guideline or preprint, and the reference wears it as a label in its list. four more are for other subjects. primary is the record itself and secondary an account of it, which is what history asks first of a source: on this page caesar is the one, and the encyclopaedia that transcribes trajan's column is the other. vendor is what the maker of a thing says about it, and benchmark is somebody's measurement of it. three papers about vitamin d show why it is worth a word. in a cohort of 13,331 adults, those with the least of it in their blood died at a higher rate over the nine years or so that followed (melamed and others 2008). in a trial, 25,871 people took it or a placebo for about five years, and about as many broke a bone either way (leboff and others 2022). and a review that pooled 81 trials found no effect on fractures or falls (bolland and others 2018). the first kind can say that two things go together, and only the other two can say what a supplement does.
that aside is the other half. an article about health says once, plainly, what it is not, in an <aside class="care">. the checker asks for one in every article tagged health, and the words are the author's.
a glossary is a third list. a <dl class="glossary"> holds the words an article uses in a sense of its own, each a <dfn>, in the order of the alphabet. a word in the text that links to its entry sits on a dotted line, and a press on it opens what it means under the line it is on, the way a note opens. four words on this page do, where each is first explained, and this is where they lead:
feed.xml, with every article in it whole. a feed reader follows the blog through it. the search reads a file written with it: the same words, without their markup.index.html, its stylesheet and its script. it draws the sidebar and sets the article that was asked for.<p>the blog is one html page, the <a href="#term-frame">frame</a>.</p>
<dl class="glossary">
<dt id="term-frame"><dfn>frame</dfn></dt>
<dd>the page every address is set in …</dd>
</dl><p>nothing comes from another site.<sup><a href="#note-fonts">1</a></sup></p>
<p>… its feed is an atom feed (<a href="#rfc-4287">nottingham and sayre 2005</a>).</p>
<ol class="notes">
<li id="note-fonts">the font's files are served from the blog's own folder.</li>
</ol>
<ol class="refs">
<li id="rfc-4287"><cite>Nottingham, M. & Sayre, R., eds. (2005).
<i>The Atom Syndication Format</i>. RFC 4287.</cite></li>
<li id="leboff-2022" data-kind="trial"><cite>LeBoff, M. S., Chou, S. H., Ratliff, K. A. et al. (2022). …</cite></li>
</ol>
<aside class="care"><strong>a word of care.</strong> nothing here is advice about what to take …</aside>an article is listed in the library with a title, a line that says what it is, and a date. three more fields are optional:
{
  "section": "software",
  "slug": "everything-this-blog-can-do",
  "title": "everything this blog can do",
  "deck": "every piece an article can use, shown and explained.",
  "date": "2026-10-12",
  "updated": "2026-10-12",
  "tags": ["blog", "writing"]
}"series" are parts of one thing. each says which part it is beside its date, and lists them all in order at its foot.robots.txt names it.two more fields are for an article that is not in english. "lang" says which language it is in, and the frame marks its title and its text as that language, for the software that reads a page aloud or breaks its words. a translation also names what it translates, as "translates": "software/opencode-go-model-league", and the checker sees that each of the two leads to the other. the league of models is one: it can be read en español.
the same entry is what a link to this article says of it somewhere else. paste a link into a chat, and the software there fetches it, reads the top of the file for a title, a line about it and a picture, and runs no script. so the first lines of this article's own file say both, among the lines that make the file a page: those the front page starts with, the frame's stylesheet and script among them. nobody wrote them: scripts/head.mjs did, from the entry above and the top of index.html, and the checker fails when they disagree. the one before the last is for a search engine: the title, the dates, who wrote it and the picture, as the data schema.org calls an article. an article that shares tags with others has one more line above it, which names the ones its foot leads to. the last is for the frame and not for a preview: it names the pieces this article needs, which is all of them.
<!doctype html>
<html lang="en">
<meta charset="utf-8">
<title>everything this blog can do · nahuel genchi</title>
<meta name="description" content="every piece an article can use, shown and explained.">
…
<link rel="stylesheet" href="../../assets/site.css">
…
<script type="module" src="../../assets/site.js"></script>
<link rel="canonical" href="https://nahuelgenchi.com/typography/everything-this-blog-can-do/">
<meta property="og:type" content="article">
<meta property="og:site_name" content="nahuel genchi">
<meta property="og:title" content="everything this blog can do">
<meta property="og:description" content="every piece an article can use, shown and explained.">
<meta property="og:url" content="https://nahuelgenchi.com/typography/everything-this-blog-can-do/">
<meta property="og:image" content="https://nahuelgenchi.com/typography/everything-this-blog-can-do/preview.png">
<meta property="og:image:width" content="1200">
<meta property="og:image:height" content="630">
<meta property="og:image:alt" content="everything this blog can do. every piece an article can use, shown and explained.">
<meta property="article:published_time" content="2026-10-12">
<meta property="article:modified_time" content="2026-10-14">
<meta name="twitter:card" content="summary_large_image">
<script type="application/ld+json">{"@context":"https://schema.org","@type":"Article","headline":"everything this blog can do",…}</script>
<meta name="pieces" content="code pair.css callouts tabs listing chart bars …">
the frame leaves those lines out when it sets the article, and so do the feed and the search. they add about 850 bytes to each article, gzipped. the address in the bar is always the page's own, the one the feed gives out too, so whatever a reader copies, a preview of it is a preview of the article.
the picture is a card in the blog's own type, on its own paper: the article's section and date, its title over its deck, and the blog's name at the foot. scripts/cards.mjs draws it in a browser with no window and writes it beside the article, as preview.png. the front page, the sections and the tags all show the blog's own card. a card carries, inside the file, a fingerprint of what it was drawn from, so the checker can tell without a browser when a title, a deck, a colour or the type has moved on without it, and only a card that has fallen behind is drawn again. this page's card is what a link to it shows.
the third field, "updated", is the day an article last changed, and it comes with a duty: the article has to say what changed. the smallest change is made where it stands, with <del> for what was taken out and <ins> for what was put in. the article on haiku 5.5 first said of four scores that they were inside half a point of each other inside two points of each other, three of them inside 0.6, with the four scores written in the same sentence.
anything larger goes in a list with class="changes": one dated entry for each day the article was touched, newest first. the date at the top of the page then gains an “updated”, linked to the list, and the checker will not let the list and the library disagree about the day. this page has one, and so does the article that needed it most.
<p>… they were <del>inside half a point</del> <ins>inside two points</ins> of each other.</p>

<h2>changes</h2>

<ul class="changes">
  <li><time datetime="2026-10-12">12 october 2026</time> twelve sentences and labels
    disagreed with the numbers beside them, and were made to agree.</li>
</ul>one script, scripts/check.mjs, reads the whole blog and fails on anything that breaks a rule. it runs on every pull request, and nothing reaches the blog without passing it. it checks that:
a second, scripts/browse.mjs, opens every page in chrome, as a small phone, a phone, a laptop and a screen wide enough for notes in the margin, and fails on what only a browser sees: a script that throws, a request that fails or leaves the blog, an article asked for again when its link is pressed after the pointer rested on it, a link that does not fade one page into the next, or does for a reader who asked for less motion, a change to the blog that does not reach a reader who comes back, a page they opened that does not open again with no connection, a long article that does not offer the part its reader left off at, a picture that does not load, a word the search reads otherwise than a browser would, a chart left as a table, a page wider than its screen, and anything drawn past its left edge, where no reader can scroll to it. it also measures four things a look used to be the only check for: no words are drawn over other words, a formula on a line of its own sits in the middle of the text, the pictures of a set sit together, and nothing is drawn over a note in the margin, or waits below one with no need to. it holds the type back until a page has drawn without it, as a slow first visit does, and fails when the page then moves more than a line that gains a word would move it. it reads every letter the page sets in newsreader too, and fails on one that no file of it has, or on a file the page asks for and draws nothing from. and four that a reader who hears the page, moves through it by keys or sees it faintly depends on: every link, control and picture has a name a screen reader can say, every table has a caption, whatever takes the focus shows it, and every letter stands far enough from what is behind it, 4.5 to 1, or 3 to 1 when it is large, in the ink of every section. then it opens every page once more for a reader who asks their system for more contrast, and fails on small print that stands under 7 to 1, and once more as windows draws it for a reader who has asked for more contrast still, in a few colours of its own, and fails on whatever those would paint out, uncover or run together: a mark drawn in a colour alone, words under a cover, two series with one key.
neither can check that a page reads well. that part is done by looking, on a phone and on a wide screen.
robots.txt, and the first lines of each article now tell a search engine its title, its dates, who wrote it and its picture. around the article says so. and the search no longer reads the whole feed: it reads the words of every article from a file written with the feed, without their markup, and finds what it found before. the second check has chrome read the feed and fails where the two disagree. and a reader who asks their system for more contrast now gets darker small print, 7 to 1 or more wherever it stands, and nothing else changes: the frame around an article says how to see it. the second check opens every page that way once more. and an article starts loading when its link has been pointed at for a moment, or is focused or pressed, and not when a pointer only passes over it or the connection asks to save data. the second check rests the pointer on a link before pressing it, and fails when the press has to ask for the article again. and the old page now fades into the new one as a link is followed, but not for a reader who asks for less motion: the second check follows a link both ways and counts the fades. and an article's foot now leads to up to three others that share the most tags with it, chosen by a script and written into its first lines: the frame around an article says how. none has one yet. and what a reader opens is kept in their browser, to open again with no connection, by a worker that changes nothing while there is one: the frame around an article says what it keeps. the second check makes a change to the blog between two visits and fails when the reader comes back to the old page, then cuts the connection and fails when what they opened does not open again. and an article of 20 minutes or more, as this one is, offers the part its reader left off at when they come back, from a piece only such an article fetches: the frame around an article says how to try it. the frame is allowed 14 kb now, up from 13.5, for these and for the next few things it does for every page, and this article 60, up from 56, to show them.scripts/tour.mjs. the checker now fails when what the page says the frame and the pieces weigh falls behind them, and the tree under lists is the folder as it is now. the page is allowed 56 kb now, up from 52: every step the frame takes adds a row to several of its tables. and a formula with a caption is centred on the text, as the caption is, and no longer on its figure, which can run wider. panels held to two or three in a row sit together at their own size, and a figure that holds nothing wider than the text stays beside a note in the margin instead of waiting below it. the notes piece measures the figures to know which, and is allowed 3.5 kb now, up from 3. the page names its second check too, which opens every page at a third width now and measures three things only a look used to catch. it opens every page at 320 px too, as wide as a laptop's screen zoomed to 400%. and a reader's browser keeps the fonts for a year now, and shows pictures, clips and sounds from its own copy while it asks whether they changed. the frame, the pieces and the pages are still asked about every time, since their names carry no version. the second check measures four more things now: whether every link, control and picture has a name a screen reader can say, whether every table has a caption, whether the focus shows wherever it lands, and whether every letter stands out from what is behind it, in every section's ink. what it found is mended: the keys have a caption, and a missing value, the numbers beside lines of code, and small print on a tint in the dump, the alignment, the tree and marked code are darker. it also holds the type back now until a page has drawn without it, and fails when the page moves. what that found is mended too: a long title no longer changes its lines when newsreader arrives, since its width is set in em instead of in figures of whatever face is drawn. and the blog reads in windows high contrast now, where the system paints every page in a few colours of its own: the series of a chart keep a fill, a dash or a line of their own, a tint that picked something out is an outline or an underline, a mark keeps its ground, and a drawing keeps its own paper. the second check opens every page once more in those colours. the frame is allowed 13.5 kb now, up from 13, and seven pieces half a kb more each. and the type is lighter: each face comes in two files now, the letters nearly every article uses and the rarer ones, and a page fetches the second only when it has one of them. a page fetches 41 kb of type instead of 57, or 86 instead of 120 when it has a word in italic. and a table beside notes in the margin is as wide as the text until its columns ask for more, as a block of code is, so that one that needs no more stays beside a note instead of leaving a hole in the text below it. a table or a block of code on its own stays beside one too, and the second check fails on a hole that need not be there. and the word on a loop in a graph is set where the loop turns, under what it leaves, and no longer on the side, where half of it lay outside the drawing and, on a phone, past the edge of the screen. the drawing makes room for its loops, and the graph piece is allowed 3.5 kb now, up from 3. the second check fails on anything drawn past the left edge of the screen, where no reader can scroll to it. and on a phone the words of a graph no longer run into each other: an edge bends nearer the end it shares with more edges, and its word is set halfway down, where the edge is on its own, so the words of three edges out of one box stand nearly as far apart as the boxes they lead to. a loop runs in room the layers leave it at the side, clear of the boxes, and a name too long for its share of the width takes two lines. the second check fails on words drawn over other words.#: every article, section and tag is now a folder with a page in it, and the addresses from before still lead to the same places. how a page reaches you and around the article say so now, with the frame's new weight and this file's new first lines. every picture on the page, and every one in a sample, is written loading="lazy", so that it still waits for the reader there. and a link to any page of the blog now brings a picture into its preview, a card in the blog's own type: around the article says how it is drawn.